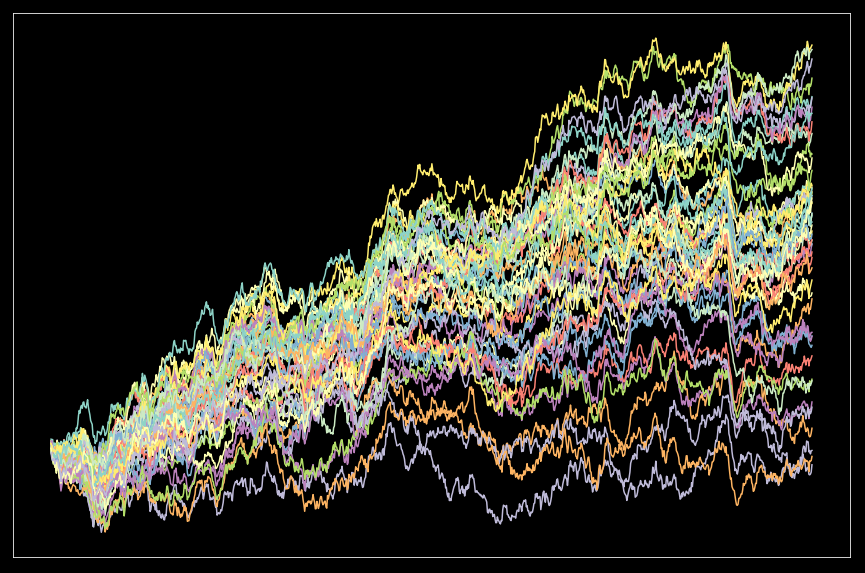
In Statistics, the formal name for the concept of randomness or uncertainty is called “stochasticity”. A stochastic process is a type of mathematical model that describes a process that evolves over time and is governed by randomness or uncertainty. The term “stochastic” is used to describe any process or variable that is subject to random fluctuations or uncertainty.
Stochastic processes can be characterized by their probability distributions, which describe the possible outcomes of the process and the likelihood of each outcome. These probability distributions are often used to make predictions and to analyze the behavior of the process over time.
In formal terms, the study of stochastic processes is known as “Stochastic Processes” or “Probabilistic Time Series Analysis” in statistics. It is a branch of mathematics and statistics that deals with the modeling and analysis of random phenomena that evolve over time.
Some common examples of stochastic processes used in econometrics include:
White noise: A sequence of uncorrelated random variables with constant mean and variance. White noise is often used as a simple model for random errors or shocks in econometric models
Autoregressive processes (AR): A type of time series model in which the current value of the series is a linear function of past values and a white noise error term. Autoregressive models are widely used in econometrics for modeling and forecasting time series data.
Moving average processes (MA): A type of time series model in which the current value of the series is a linear function of past white noise errors. Moving average models are often used in conjunction with autoregressive models to capture different types of patterns in time series data.
Autoregressive moving average processes (ARMA) and Autoregressive integrated moving average (ARIMA): These models are a combination of Autoregressive and Moving average models, they are used when the time series data is not stationary and it requires differencing before being able to fit the model.
GARCH models: Generalized Autoregressive Conditional Heteroskedasticity models, it’s used to model volatility clustering in the time series data, where volatility is not constant over time.
These processes are used to model and analyze time-series data and can be used in conjunction with other econometrics techniques such as time-series analysis, forecasting, and causal inference.
For example, in time series analysis, stochastic processes such as white noise, autoregressive (AR) processes, moving average (MA) processes, autoregressive moving average (ARMA) processes, autoregressive integrated moving average (ARIMA) and GARCH models can be used to model and analyze the patterns in the data. The choice of which stochastic process to use depends on the specific characteristics of the data, such as stationarity and the presence of trends or seasonality.
In Bayesian econometrics, stochastic processes such as Markov Chain Monte Carlo (MCMC) can be used to generate samples from the posterior distribution of the parameters of the model.
Here are some examples to illustrate how to use each of these techniques:
White noise: An economist wants to study the impact of random shocks on the economy. They collect data on a number of economic variables, such as GDP, inflation, and unemployment, and they notice that the data contains random fluctuations. The economist can use a white noise process to model these random fluctuations. A white noise process is a sequence of uncorrelated random variables with constant mean and variance. The economist can use this model to analyze the impact of the random shocks on the economy and to make predictions about future economic conditions.
Autoregressive processes (AR): An economist wants to forecast the future values of GDP. They collect data on GDP for a number of years. They notice that the current GDP depends on the previous GDP and a random shock. Therefore, they use an autoregressive process of order 1 (AR(1)) to model GDP. This process assumes that the current GDP is a linear function of the previous GDP and a white noise error term. The economist can use this model to make predictions about future GDP and to analyze the behavior of GDP over time.
Moving average processes (MA): An economist wants to study the impact of random shocks on the exchange rate between two countries. They collect data on the exchange rate for a number of years. They notice that the current exchange rate depends on a random shock but not on the past values of the exchange rate. Therefore, they use a moving average process of order 1 (MA(1)) to model the exchange rate. This process assumes that the current exchange rate is a linear function of past white noise errors. The economist can use this model to analyze the impact of the random shocks on the exchange rate and to make predictions about future exchange rates.
Autoregressive moving average processes (ARMA): An economist wants to forecast the future values of inflation. They collect data on inflation for a number of years. They notice that the current inflation depends on past inflation as well as past errors. Therefore, they use an autoregressive moving average process (ARMA(p,q)) to model inflation. This process combines the autoregressive process and moving average process, it allows for modeling the dependence of the current value on past values and past errors. The economist can use this model to make predictions about future inflation and to analyze the behavior of inflation over time.
GARCH models: An economist wants to forecast the future volatility of a stock return. They collect data on the stock return for a number of years. They notice that the volatility is not constant over time, but instead, it clusters. Therefore, they use a GARCH(1,1) model to model the volatility. GARCH(1,1) is a type of model that allows for volatility to change over time, it’s widely used in finance. With this model, the economist can make predictions about future volatility and analyze the behavior of volatility over time, as well as make predictions about the stock return.
