

As countries engage in trade, one variable that will arise and needs to be dealt with is the currency pair: I am in Portugal, you are in the US, we do business together and you pay me in euros. Same thing if I buy something from you I’ll pay it in US Dollars. Since the relationship between this currency pair is not 1:1, there will be inevitably one party that will have to put up more money than the other one. In this article, we will address this and more.
When dealing with Foreign Exchange or FOREX for its friends, you need to always be thinking about two graphs at the same time. Let’s continue with our example of a trade between Portugal that uses the eur and the US that uses the US dollar.
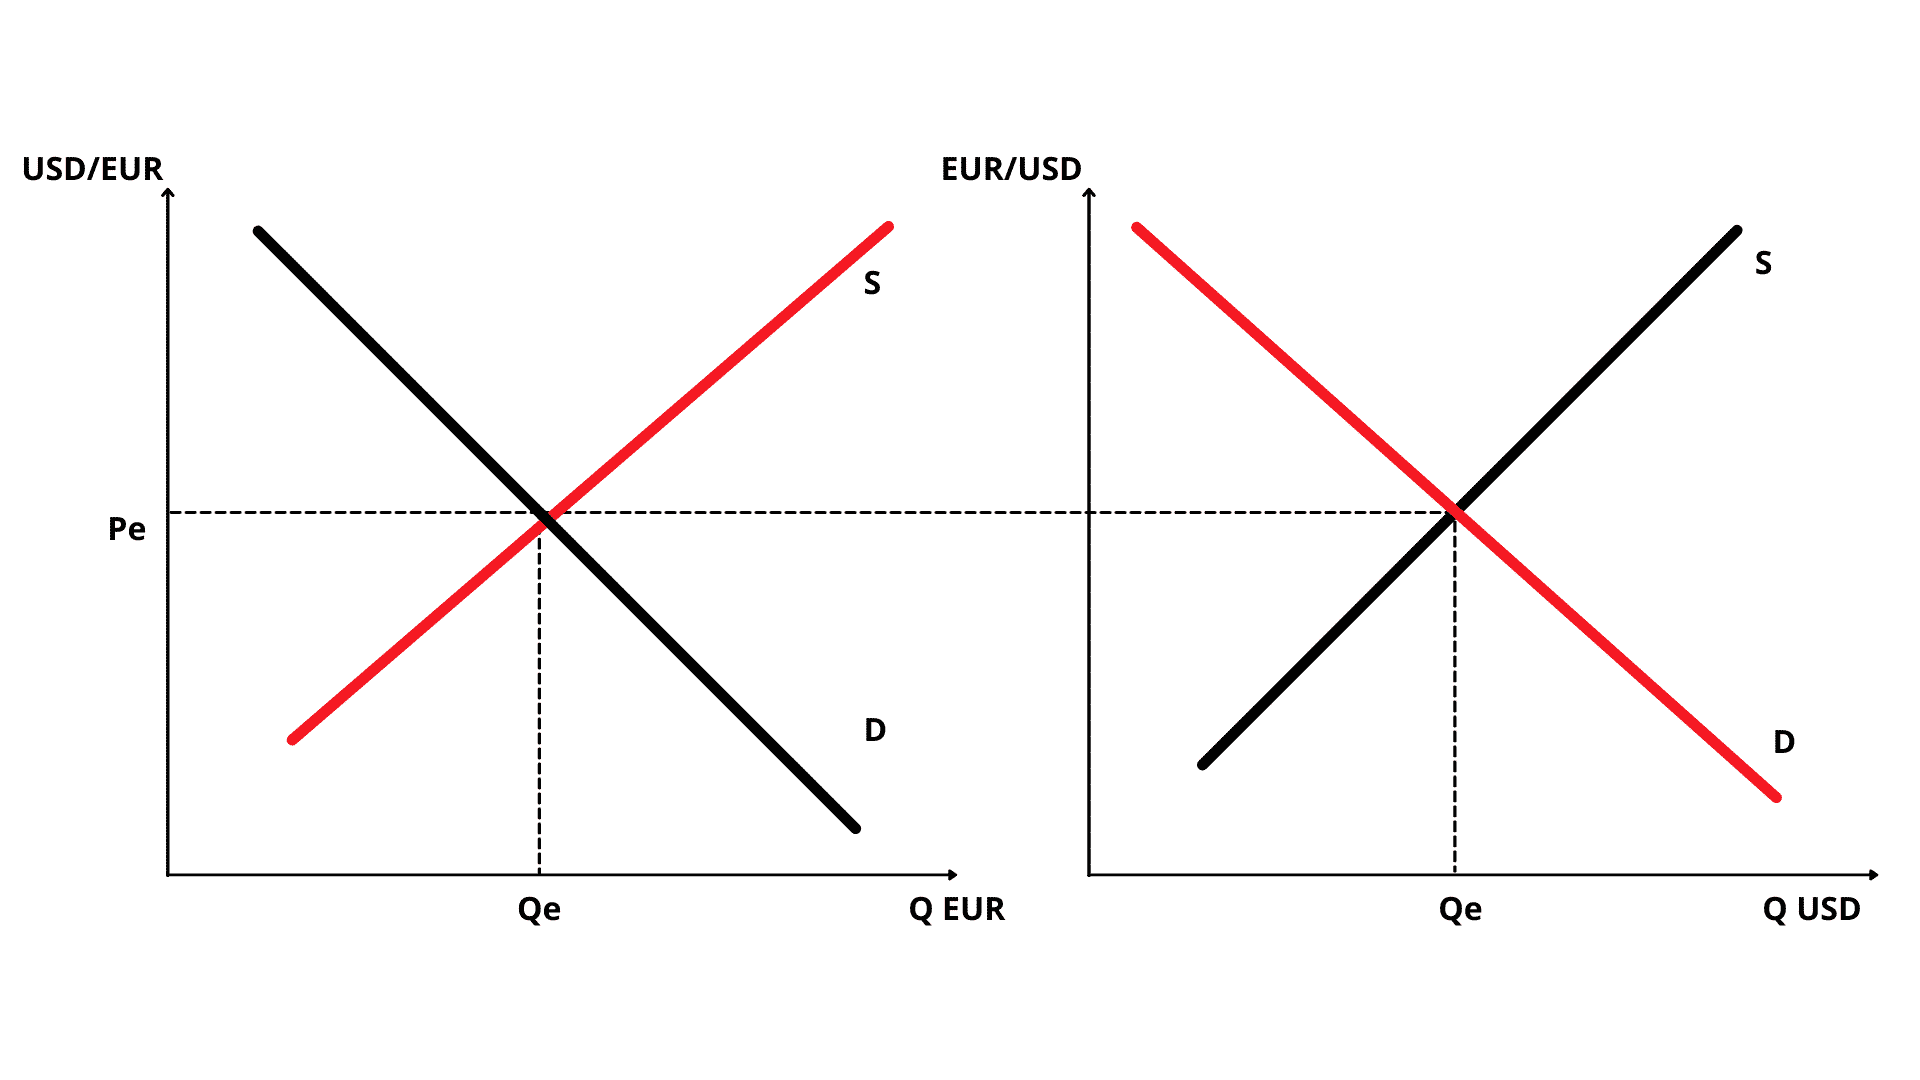
Check the graph on the left. Here we are saying: one eur is equivalente to x usd if we did that trade. And where Supply equals demand, a certain amount of eur would be traded.
So if we had a 1:1 ratio, meaning 1 eur = 1 dollar, the graph on the right would be exactly the same but in reverse: 1 dollar = 1 eur, with the same quantity in equilibrium being exchanged betweetn both countries.
What you need to remember from this is that the second graph is always the inverse of the first: let’s say (starting from the left graph) that 1 EUR = 2 USD. This means that on the right graph, the ratio between currencies would be inverse: 1 USD = 1/2 EUR with the quantity in both graphs of the currency supplied being the same.
Remember that the Demand is always from the other country and the Supply is from the same country. So, the graph on the left, the Quantity Demanded of EUR is coming from the US and the Quantity Supplied is from Europe.
This might sound simple, but it starts getting confusing real soon if you don’t get this right. Remember the currency on the bottom is always 1 unit, and on the top is what one unit is equivalent in the other currency. So if we have USD/EUR = 0.8976, this means that 1 eur buys 0.8976 USD
Currency Appreciation and Currency Depreciation
You’ve probably heard about currency appreciation and depreciation. This is what we have just been talking about but a comparision. Let’s look at an example:
Let’s stay we start off with USD/EUR = 0.8976 and 2 months after, USD/EUR = 1.1105
What does this mean?
2 months before 1 EUR wasn’t enough to buy 1 USD. It just bought 0.8976 USD and now, two months after, 1 EUR buys 1.1105 USD. So essentially we have one of two possible scenarios: either the EUR is worth more or the USD is worth less. We can say that the EUR appreciated against the USD or that the USD depreciated against the EUR, either one is fine.
So, what makes this happen? 2 months before you needed more EUR to make a purchase on Amazon.com and now, 2 months after, you can buy the same article with less EUR.
There are 4 key factors that make the foreign exchange curves shift. These are:
1. Tastes and Preferences
2. Price Level
3. Income
4. Interest Rates

Examples:
Increase and Decrease in US Net Exports
When US net exports increase, foreign countries exchange their currency for USD Dollars o make the purchase. this increases the demand for US Dollars, shifting the demand curve to the right, so the Dollar appreciates relative to the foreign currency that is used to make the purchase.
Same thing if US net exports decrease: there will be fewer dollars bought to pay for US exports. The demand for US Dollars decreases, so the USD depreciates.
Americans buy european cars
If Americans buy more cars, this means they sell USD to buy EUR to purchase the European Cars. As a result the supply of USD increases, shifting the Supply curve to the right and the USD depreciates.
Interest Rates
Let’s say in Europe Interest Rates are higher than in the US. To earn a higher interest, investors will get money out of the US and get it into Europe. As a result demand for USD will go down, shifting the Demand Curve to the left and the USD will depreciate.
Now let’s say interest rates in the US increase in comparison to Europe. The higher interest rates will cause the ones holding this currency to keep it, causing a shortage in the exchange market and they expect higher returns from the currency they already own. As a result the Supply curve shifts to the left and the USD appreciates.
Now let’s say political instability in Europe causes Europeans to put their money in the US. As there is more demand from foreigners for the USD, USD holders keep the currency as they see it is worth more, causing a shortage. This reduces the supply of the USD, shifting the Supply curve to the left and appreciating the Dollar vs the EUR.
Income
Let’say the income of European citizens increase. As a result, they will buy more goods both domestically and from the US. This increases the demand for USD needed to purchase the goods, shifting the Supply Curve to the right and appreciating the USD.
Now let’s say US Citizens income rise. As this happens people will make more purchases some domestically, some foreign like to Europe. This increases the supply of USD to Europe sold to acquire EUR needed to get the product. This causes tje Supply Curve to shift to the right and depreciates the USD.
Price Level
Speculators expect the USD exchange rate to increase in the near future. The higher expected rate of return on the USD causes this currency holders to keep the USD, causing a shortage in the Market. This causes the Supply curve to shift to the left, and the USD appreciates.
US reduces tariffs on European products.
A reduction on tariffs means more European goods will be imported. This in increases the supply of USD to get EUR, shifting the Supply Curve to the right and depreciating the USD.
