How to build a 1-Way ANOVA Table
This guide is to help you nail your exams in statistics, so let’s dive right in.
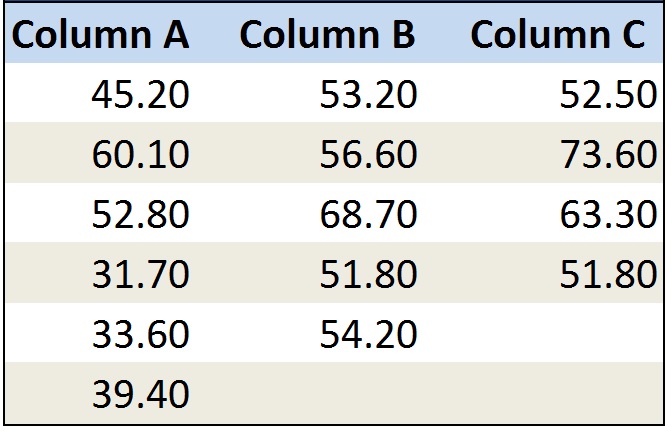
You will be given a table like the following picture. Let’s say each column represents the time each salesperson spends on the phone in any given day. Salesperson A was counted for 6 days, Salesperson B for 5 days and Salesperson C for 4 days.
Step1: count N and do the Averages
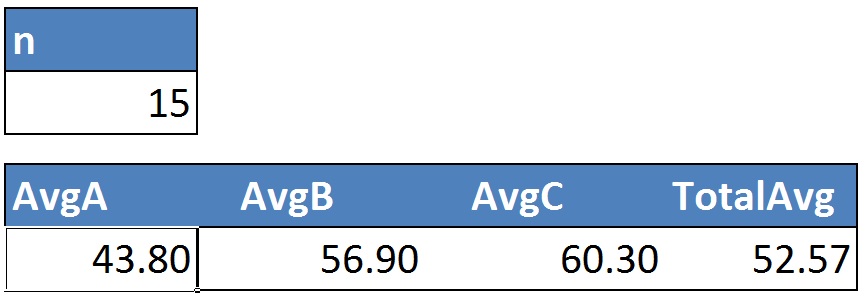
You start by counting the number of elements, so in this case n=15
Then you do the Averages for each column:
AvgA: (45.20+60.10+52.80+31.70+33.60+39.40)/6 = 43.80
AvgB: (53.20+56.60+68.79+51.80+54.20)/5 = 56.90
AvgC: (52.50+73.60+63.30+51.80)/4 = 60.30
And do the Average of the Averages
TotalAvg: (6*43.80+5*56.90+4*60.30)/15 = 52.57
Step2: Find TSS and Factor A
TSS is found by doing the following:
Square each element and add all those up. So:
45.20^2+60.10^2.+…(and so on)…+51.80^2
This will give you: 43,366.81
Then subtract n*TotalAvg^2: 15*52.57^2, which will give you 41,448.82
So the TSS is: 43,366.81 – 41,448.82 = 1,917.99
Then find Factor A. Remember that in 1-Way ANOVAS there is only Factor A (row Factor). It doesn’t matter how they present the initial dataset table to you, you look at it as a Row. So here is what you do:
Factor A: 6 * (43.80 – 52.57)^2+5 * (56.90 – 52.57)^2+ 4* (60.30 – 52.57)^2 = = 794.23
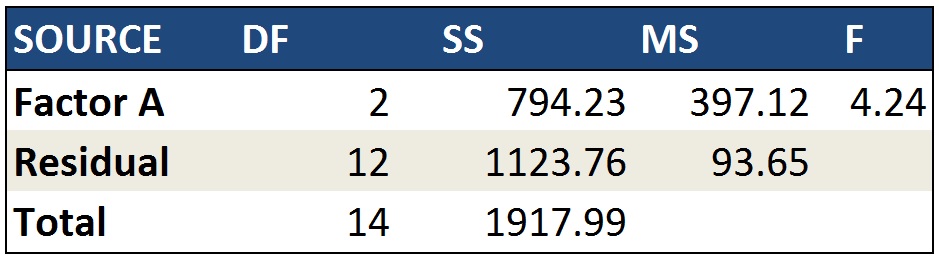
To build your 1-way anova table, you need to memorize: the headers: Source, DF(Degrees of Freedom), SS(Sum of Squares), MS(Mean Square), F-Test
Then for the rows you enter Factor A, Residual or Error(same thing) and Total.
The next step is to enter de DF. We have 3 rows, so the DF are 3-1 = 2
N=15, so our DF for N = 15-1 = 14. The residual or Error is the difference: in our case 14-2 = 12.
Moving on, for the SS, we calculate SS for FactorA = 794.23 and we also have the TSS which is 1,917.99, so to find the Residual we do the difference between both which gives us the total of 1,123.76
For the MS you just divide the SS by the DF. So for Factor A we have 794.23/2 = 397.12 and for the Residual we have 1,123.76 / 12 = 93.65
Finally to find F, you divide 397.12/93.65 = 4.24
Step3: Do the Test
They will ask something like this: “Use the analysis of variance to test whether there is any difference in the average times salespeople spend on the phone.”
They will usually tell you to use a specific significance level. Let’s say they tell you it is 5%.
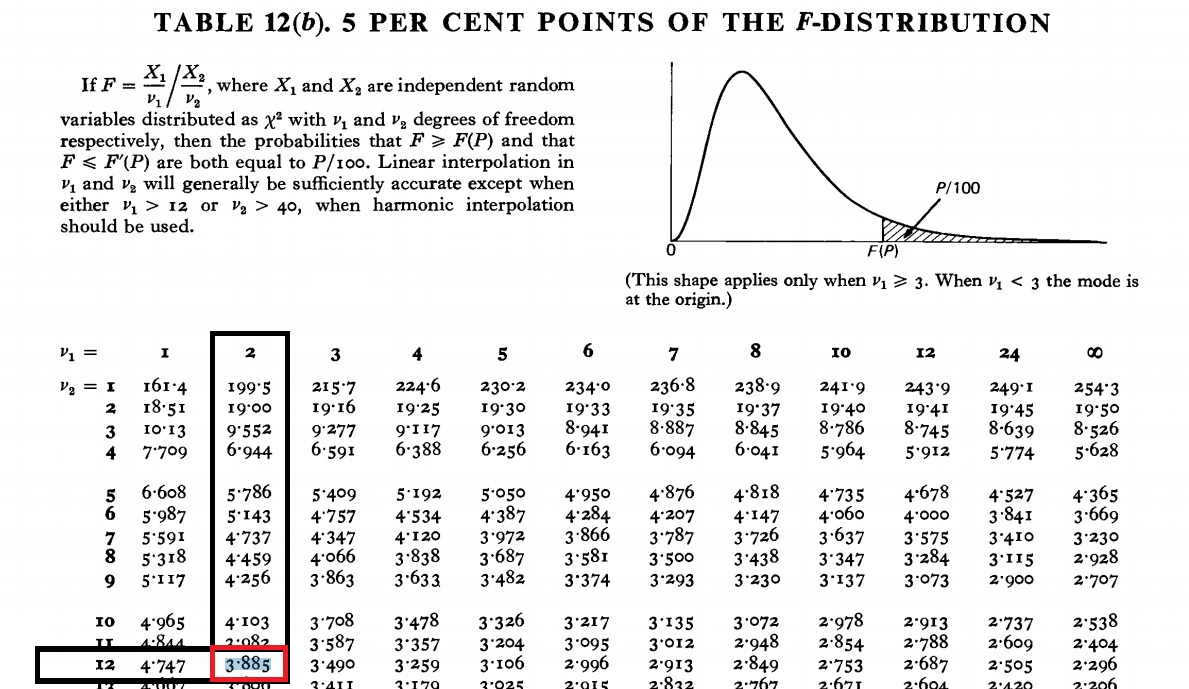
So what you do is use a Statistical F-Distribution Table at 5%(not that there are F-Tables for 10%, 2.5%, so make sure you are using the right one)
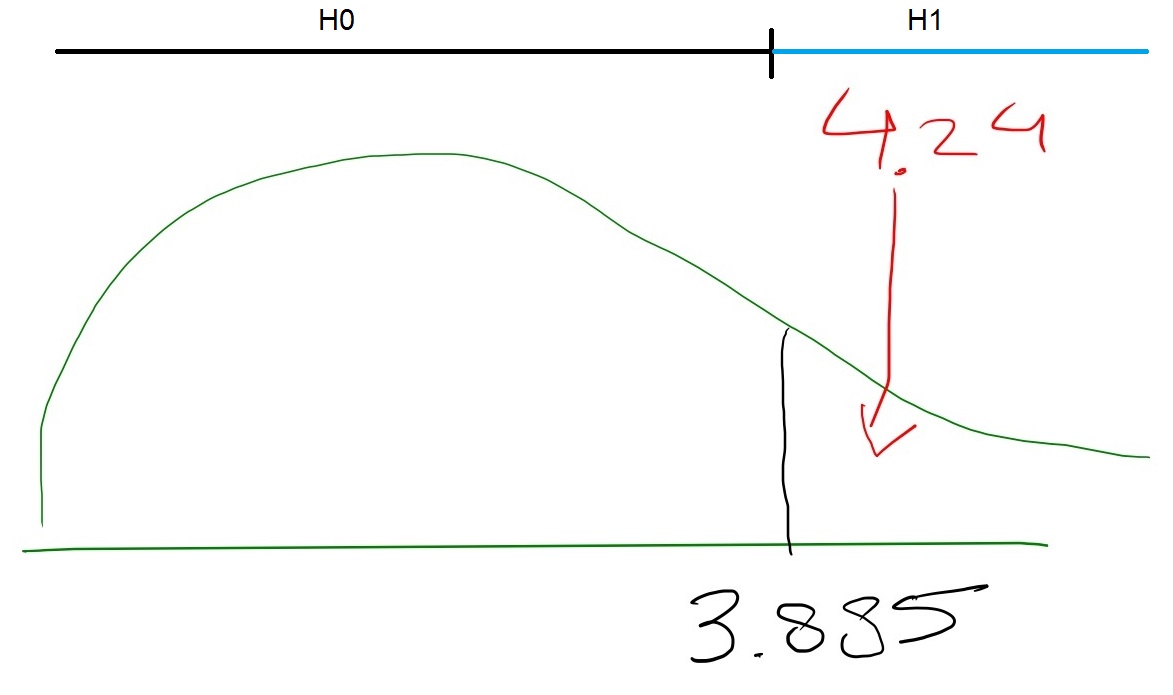
And you now have the needed values to find the corresponding entry v1= DF of Factor a = 2, and V2 = Residual = 12. From the table we get the value of 3.885
So the 3.885 is the critical value, the crossing point between the H0: (Null Hypothesis) and H1.
And you know compare it to the value from the ANOVA table which is 4.24.
Since 4.24 is greater than 3.884, this means that:
We reject the H0(null) and conclude that there is a difference in the average time salespeople spend on the phone.