
This is the framework to choose the right statistical test:
1 – Choose the type of data
Statistical variables can be classified as either measurable (continuous) or categorical(nominal or ordinal).
Categorical variables – these variables are qualitative-oriented.
1. Nominal – a nominal variable in relation to its group doesn’t have a rank. A good example is choosing your favorite color. Any color is a preference and does not hold a higher rank than other colors. Blue is the same as red.
2. Ordinal – an ordinal variable in relation to its group has a rank. A good example is the difference between a Ph.D., an MSc to a BSc all the way down to no formal education. So Ph.D. would rank 1st and no education would rank last.
Measurable variables – these variables are quantitative-oriented.
1. Interval – These include 0 value but not absolute. A good example is a Celsius scale vs a Fahrenheit scale. The scale is different and the 0 value is different as well.
2. Ratio – Here the absolute 0 is included. The Kelvin scale is a good example. It uses an absolute 0.
2 – How many Samples
There are 3 options here:
1. One Sample
2. Two Samples
3. One Sample – two measurements (it always involves a table)

3 – What is the Purpose?
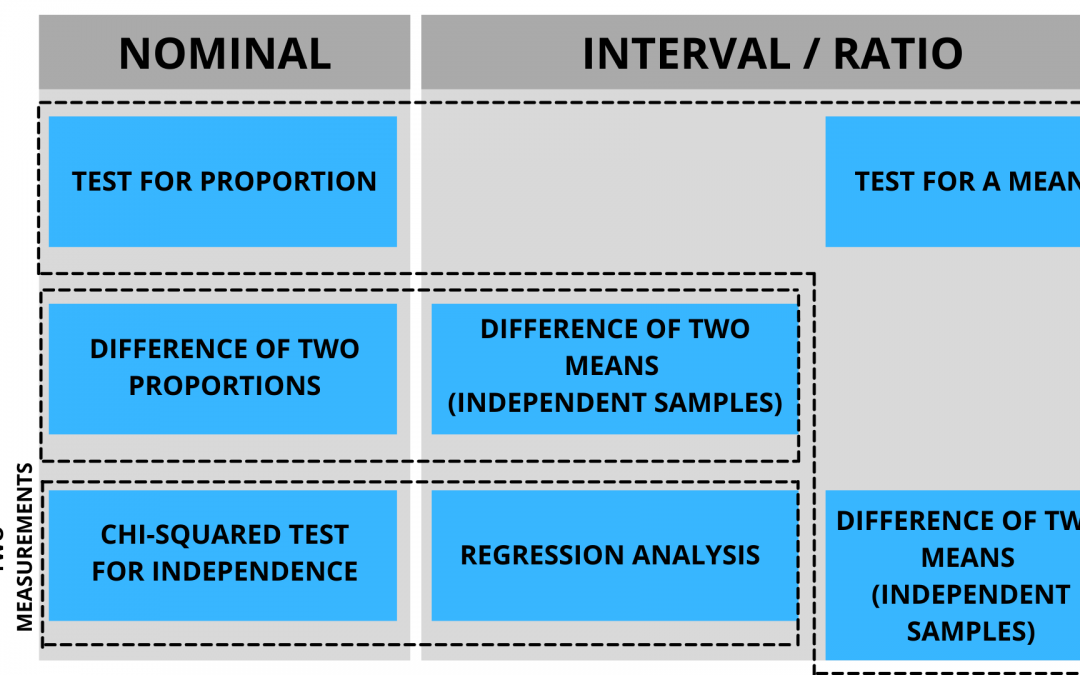
Here, you check the dotted boxes for the answer.
1. The top box (L-shaped) has the purpose of testing against a value. It has 3 possible tests:
If it is one sample it can be a test for a proportion or a test for a mean. You make your decision based on the type of data.
a) If it is a nominal variable it is a test for a proportion.
b) If it is an interval/ratio type of data then it is a test for a mean.
c) If it is one sample but with two measurements, then it is a difference of two means (paired).
2. The middlebox has the purpose of comparing two statistics.
a) If it is a nominal type of data the test is a difference of two proportions.
b) If it is an interval/ratio type of data then it is a difference of two means (independent samples).
3. The third(bottom) has the purpose of looking for a relationship. It has 2 options as well:
a) If it is a nominal type of data, it is the Chi-Squared test for independence.
b) If it is an interval/ratio type of data, then it is a regressions analysis.