

What is the Philips Curve?
In Economics we study effects from the short-run and the long-run perspective so we can make better decisions.
Williams Philips was an Economist who noticed around the 1950’s by analyzing datapoints from the UK, that whenever Interest Rates went up, unemployment also grew, and on the other hand, when interest rates went down, unemployment decreased.
Essentially, he noticed that when employment levels are high, wages rise: people have more expendable income and start buying more, so prices rise and so does inflation.
Likewise, if wages go down, people have less money to spend so inflation goes down.
But around the 1970’s, conomists found that the Philips curve didn’t hold when both inflation and unemployment rose. This is what is called stagflation (high inflation and high unemployement).
They noticed that workers could also see the effect of the curve. So when unemployment went down, workers expected inflation and demanded higher wages, causing unemployment to go back up while inflation remained high.
So economists reassessed this model by framing the first approach to the short run and adding a long run inelastic Philips curve, which is the Natural rate of Unemployment level where the Economy goes back to after a while, no matter where the Inflation rate is.
So let’s expand on this idea so we can get to the bottom of things.
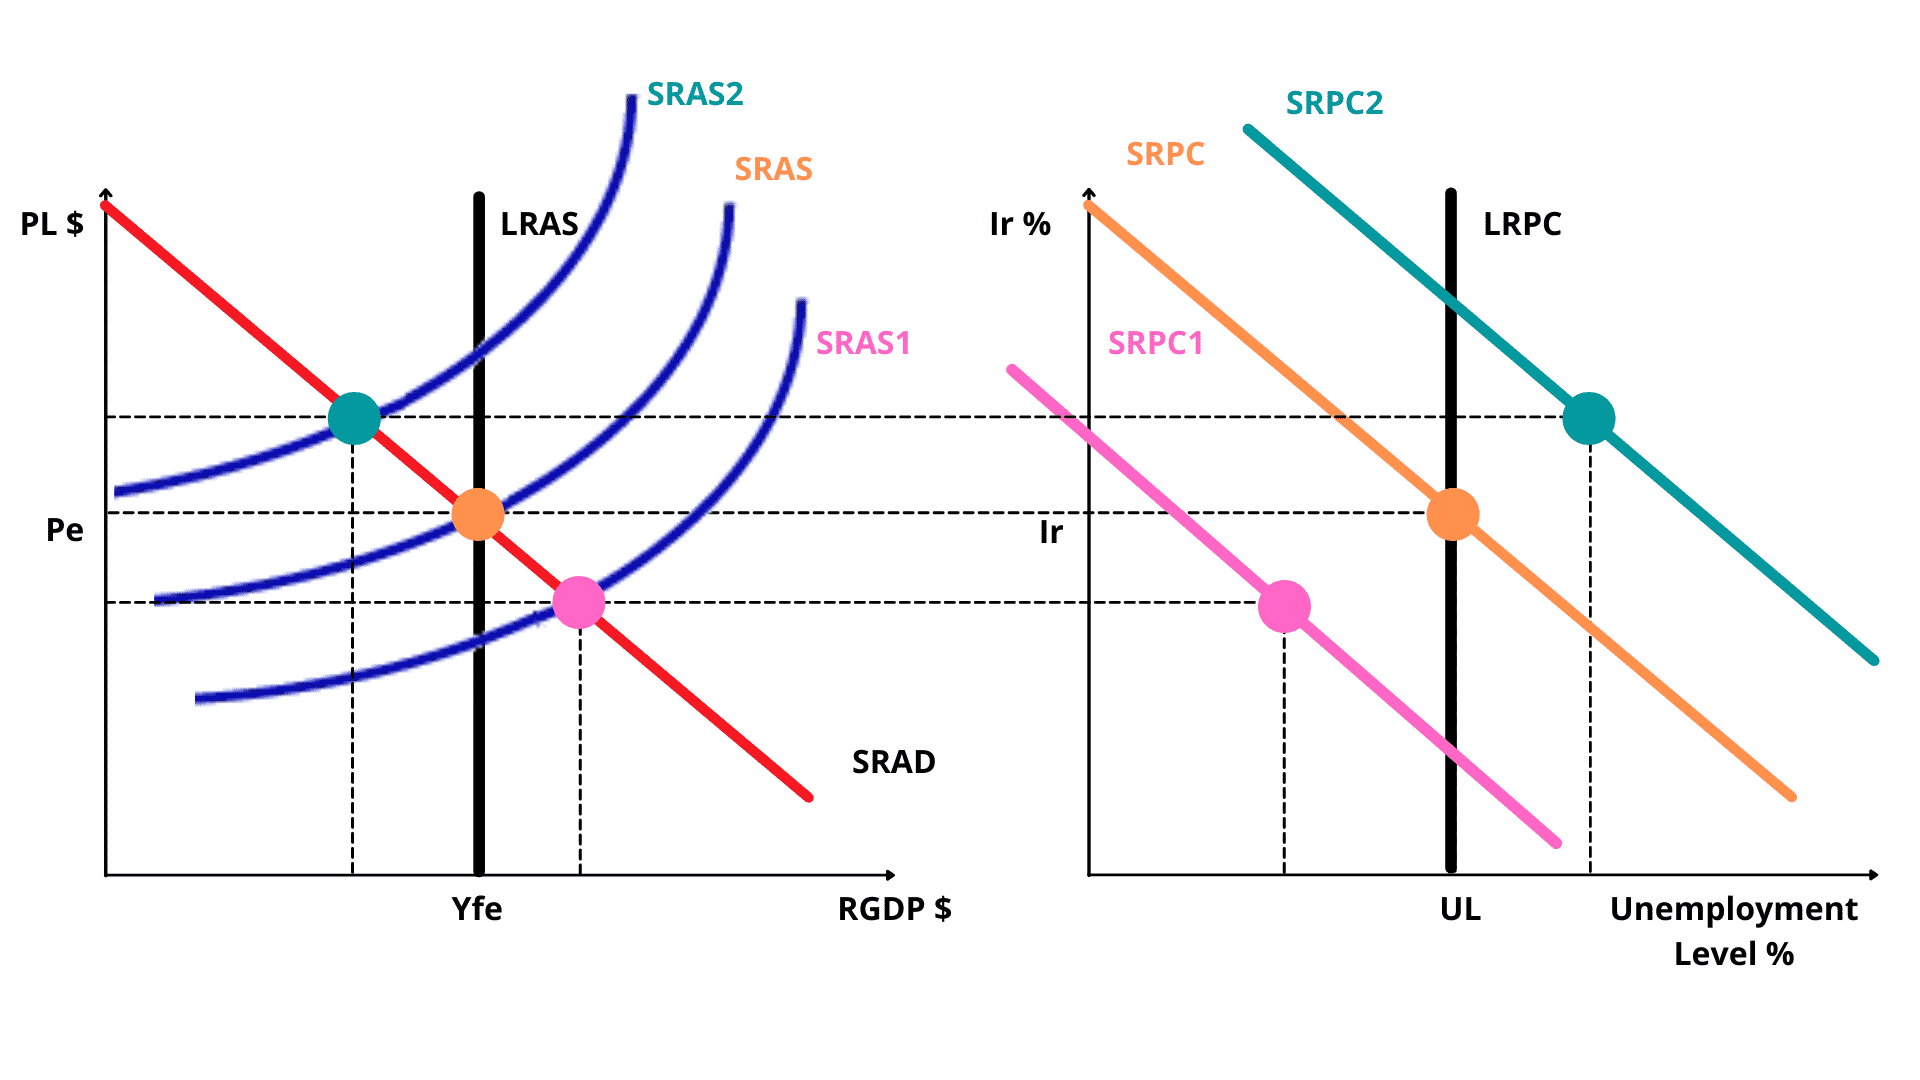
The graph on the left represents the Real GDP in relationship to the Price level, both in the short and the long run.
SRAS1
So if the Economy is throttle mode, demand is higher, prices go down. This shifts the aggregate supply curve to the right.
On the Philips curve graph, unemployment goes down and interest rates go down as well.
A demand-pull inflation can cause this: rising housing prices from low interest rate environments, increased government spending to pump up the economy causes demand-pull inflation.
SRAS2
So if the Economy is stall mode, demand is lower, prices go up. This shifts the aggregate supply curve to the right.
On the Philips curve graph, unemployment goes up and interest rates go up as well, shifting the Philips curve to the right.
A cost-push inflation can cause this like an increase in oil prices: essentially all events that can cause the increase of the production costs of the product will cause cost-push inflation.
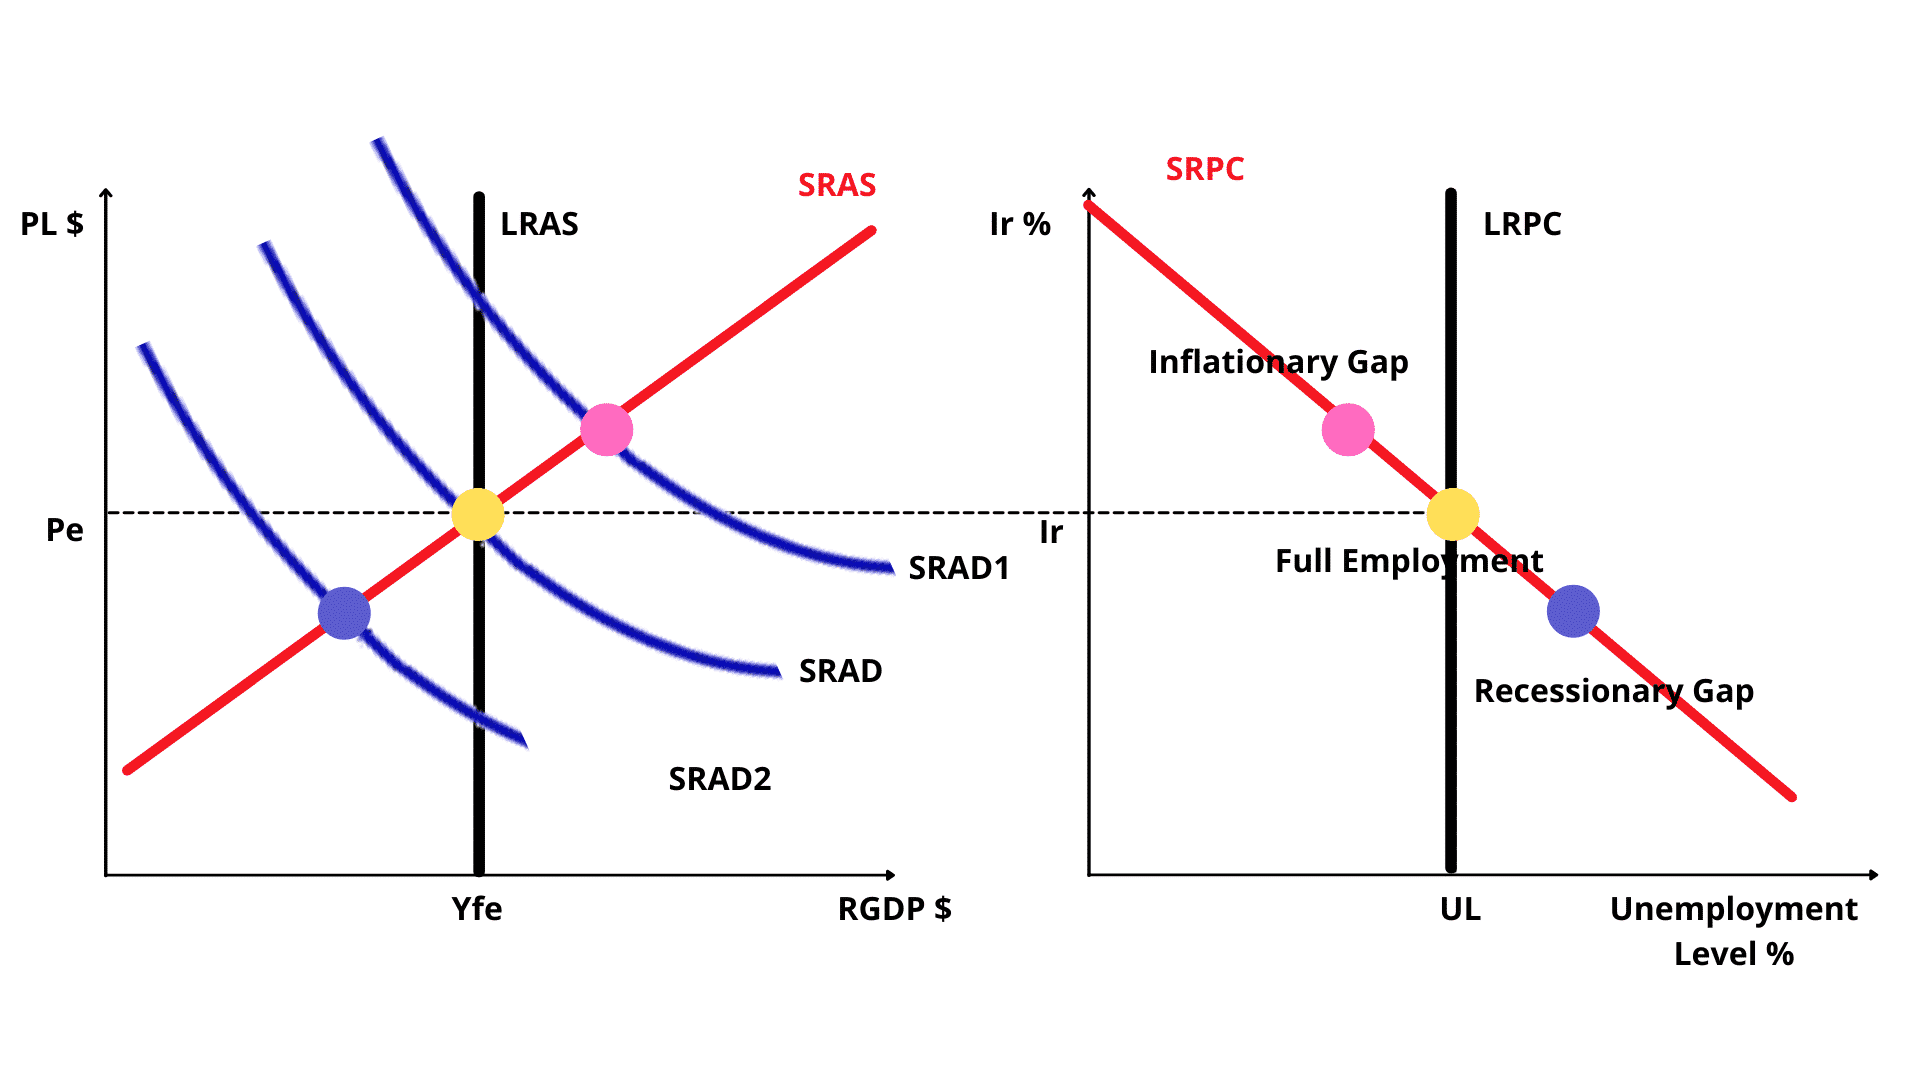
So what does this tells us?
I used the big three dots to summarize this important concept: At any given point, the Economy can only be in one of the following gaps:
1. Inflationary Gap
2. Full Employment
3. Recessionary Gap
Remember:
When aggregate demand shifts, there will be a movement along the short-run Philips Curve, but when Aggregate Supply shifts, the entire short-run Philips curve will shift.
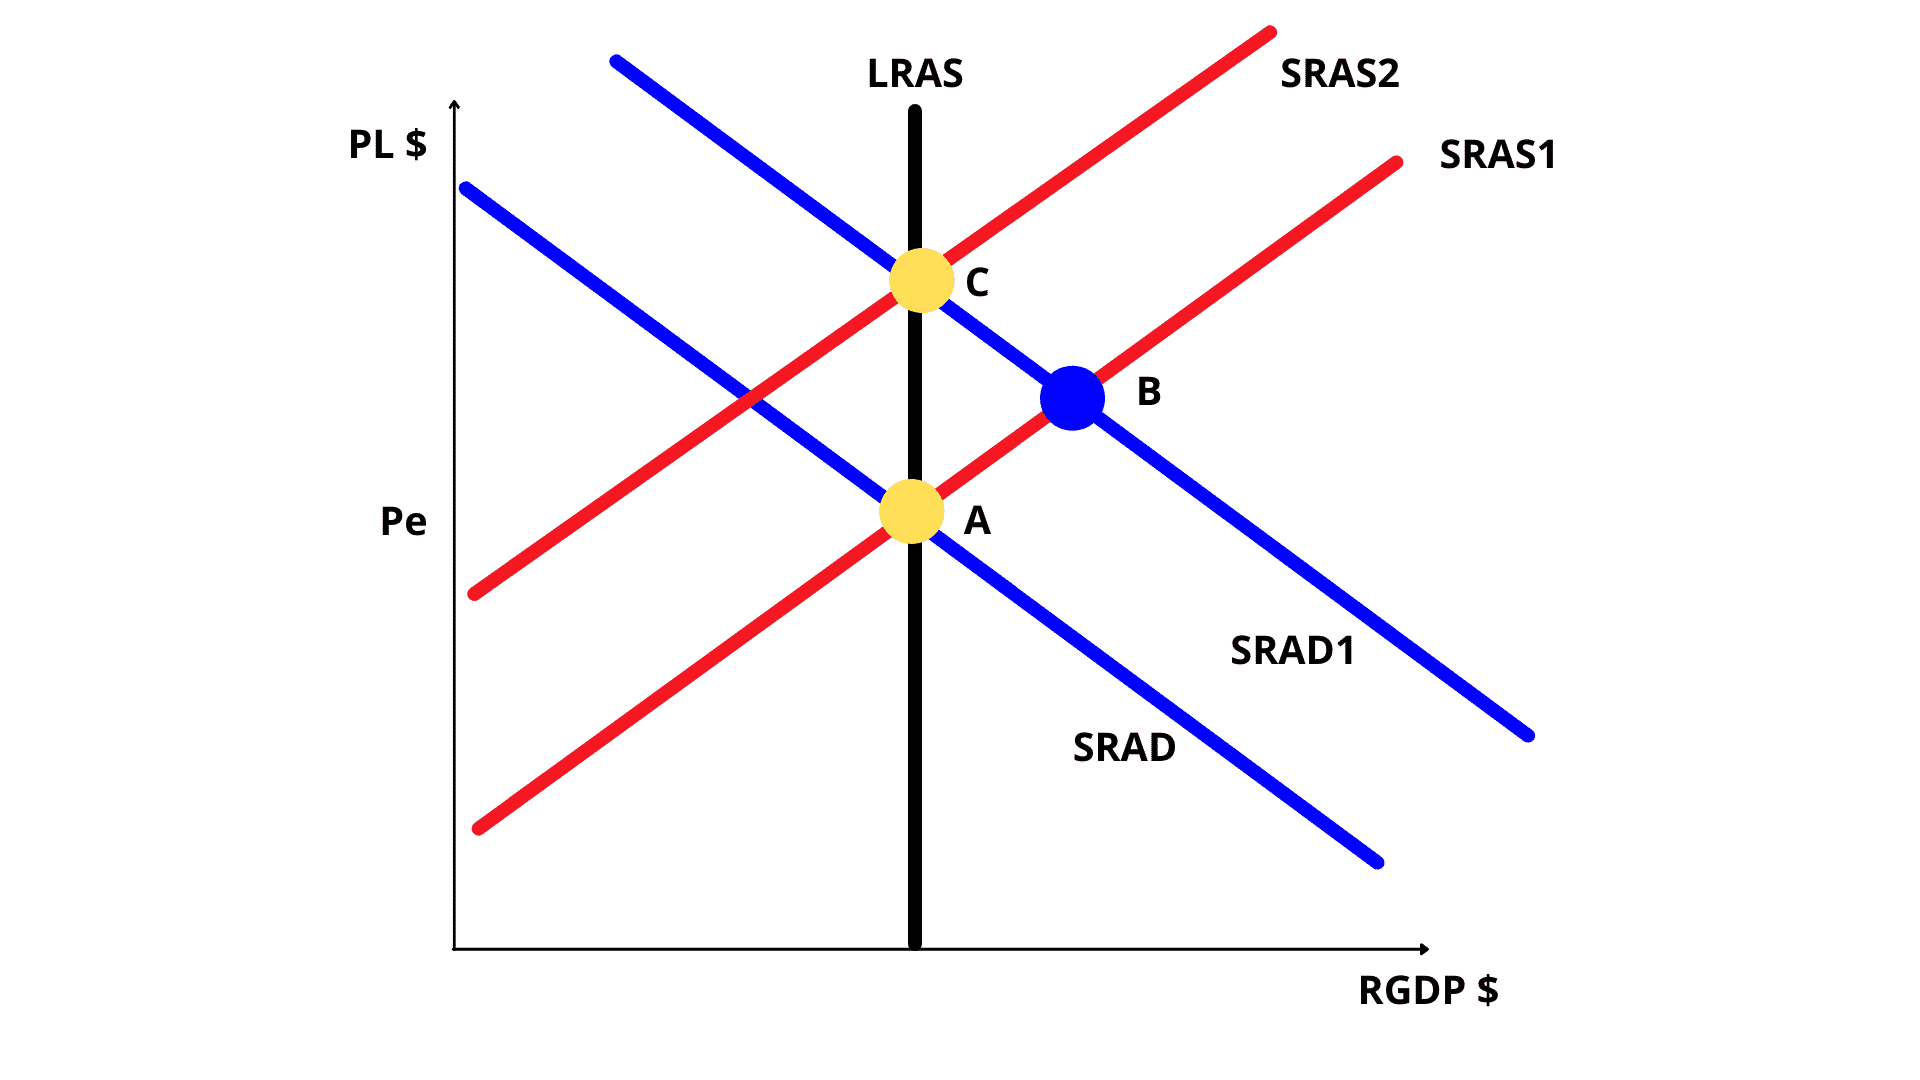
So let’s look at an example in both the short-run and long run. In the Aggregate Demand graph, if there is a demand-pull inflation, this causes the Short-run Aggregate Demand Curve to shift to the Right, effectively changing the price level from A to B, and getting the Economy in a Recessionary Gap.
After a while, this causes the Supply to adjust, making the Short Run Aggregate Supply Curve to shift to the left, getting the Price level higher at Point C, but back to the Long Run Aggregate Supply Level of Real GDP.
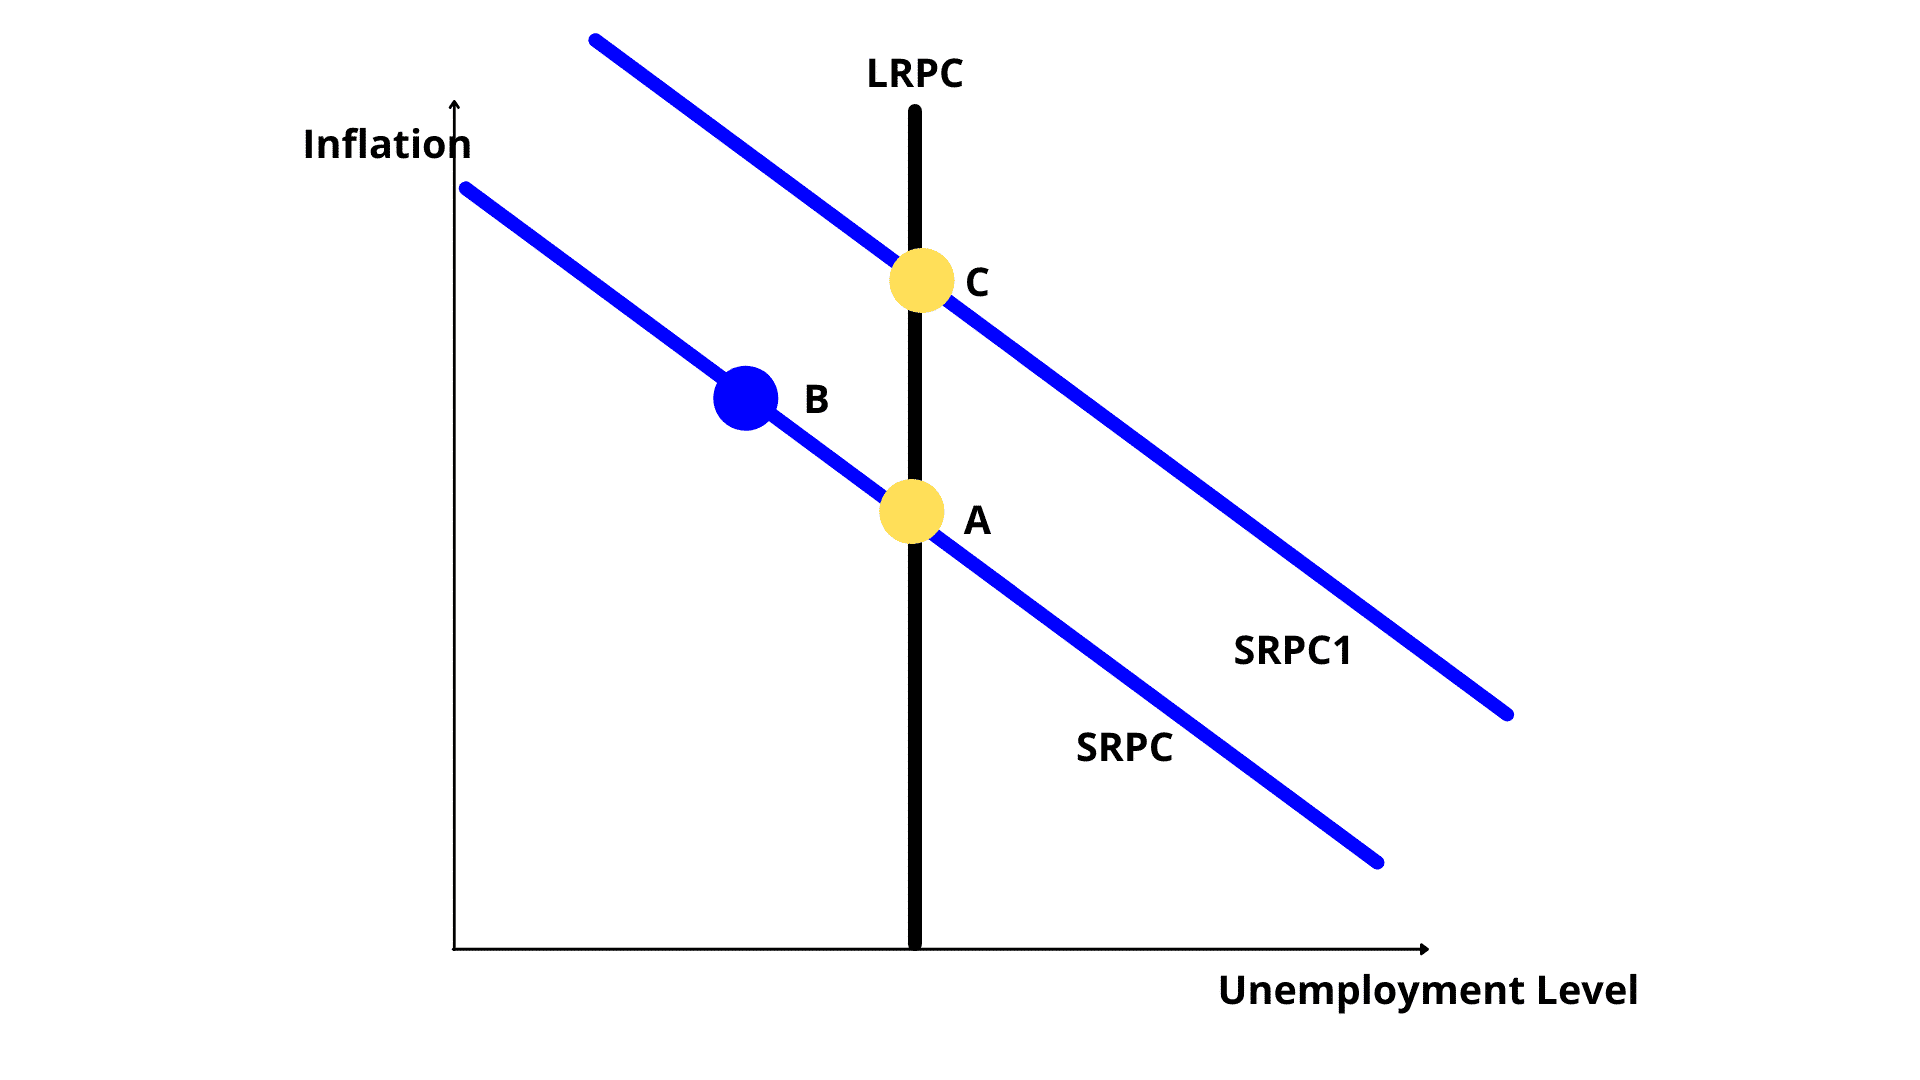
From the Philips graph, the demand pull inflation first caused a movement along the Short Run Philips curve, from A to B. This caused the Economy to be in an inflationary gap.
Since on the other graph the producers adjusted the supply level, by increasing prices at the same output, here this makes teh short run Philips curve to adjust outward(to the right), getting out of the inflationary gap, back to full employment at point C.
Examples
Movements along the SRPC
The country gets into a recessionary gap, caused by a fall in consumer confidence.
->a recessionary gap means higher levels of unemployment and lower inflation rates. It is a movement down the SRPC
Inflationary gaps
->An inflationary gap is a movement up the SRPC, showing lower unemployment rates and higher inflation.
Dramatic reduction in the price of oil
->shifts the SRPC to the left.
Inflation expectations
->SRPC shifts to the right.
Fed decreases the money supply, which means lower inflation rates and higher unemployment
->it is a movement down the SRPC.
Government increases taxes by $2M and increases spending by $2M
->This is called a balanced budget multiplier, the net effect will be to expand the economy.
This will increase the inflation rate and decrease the unemployment rate causing an upward movement in the SRPC
the Fed buys bonds on the open market.
->the increase in the money supply means higher inflation rates and higher unemployment. This is a movement up the SRPC.
expansionary fiscal policy
->movement along the SRPC to the left.
Businesses expect less inflation
->SRPC shift to the left. It’s lower inflation at the same NRU.
Tax increases lead to lower inflation rates and higher unemployment.
->It is a movement along the SRPC to the right.
Curve Shifts
negative supply shocks(hurricanes and other natural disasters)
->causes a leftward shift of the SRAS, so it causes a rightward shift in the SRPC
Increase in resource prices
->shifts the SRAS to the left is shown as a rightwards shift to the SRPC.
tech advances that allow people to find new jobs quicker
->shifts the LRPC to the left.
Increased unemployment compensation
->increases the NRU, shifting the LRPC to the right
