
What Is Standard Deviation?
When studying a dataset (collection of data), there are several measurements statisticians use in order to interpret it. The most common one is the mean. Let’s look at it with an example:
Let’s say we want to know how many pens 5 friends have in their offices:
Person#1 has 2
Person#2 has 3
Person#3 has 4
Person#4 has 7
Person#5 has 9
The total amount of pens is 2+3+4+7+9 = 25 pens
n represents our population and is equal to 5 people
The mean is the total amount of pens divided by the total amount of people. 25 divided by 5 = 5 pens.
Sometimes this number can be decimal, like 1.8 pens.
I know what you might be thinking: “How can one have 1.8 pens?”, for now, let’s leave this as a rough approximation, as we would say something like there are on average 2 pens each person has at their office. But keep this concept in mind as we are translating real-life examples to math and sometimes we need rough approximations.
In our specific case, each person has on average 5 pens inside their office.
To calculate the standard deviation we:
1. subtract the mean from the number
2. square this difference
3. divide the result by n
4. square root the result
After this step we will obtain two different measurements:
Variance = sum of all results divided by the population
Standard deviation = square root of the variance
Here our variance is 6.8 and our standard deviation is 2.6
The common greek letter for standard deviation is σ
So σ = 2.6

What does this tell us?
The mean is 5 pens and the standard deviation is 2.6
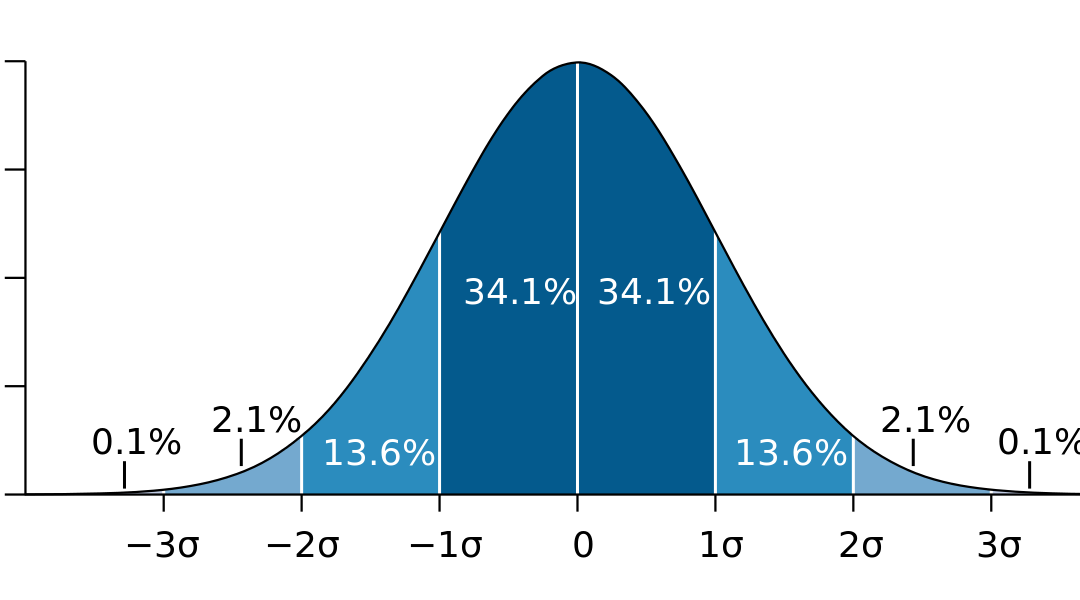
There are 3 percentiles to know in regards to the standard deviation, assuming the data is normally distributed:
68% of the data falls withing +/- 1 standard deviation from the mean
90% of the data falls withing +/- 2 standard deviation from the mean
99.7 % of the data falls withing +/- 3 standard deviation from the mean
Average results, fall within 1 standard deviation of the mean( + or -), outlier results fall within at least 2 standard deviations from the mean. Something like 1, 1, 1, 1, 1, 1, 40 (40 is an outlier. Same thing if it was a negative number)

So, coming back to our example, knowing that 68% of the data falls within 1 standard deviation, we can then say that 3 people have between (5-2.6, 5+2.6) or rounding up (2.4 to 7.6) pens in their offices.
