Maximum Likelihood Estimation
This technique allows us to find the regression line equation, but instead of using the distance of the data point to the line like we do with the Ordinary Least Squares Method, here we use the normal distribution curve of all the points in the same axis, and iterate the best normal curve that fits data at that axis.
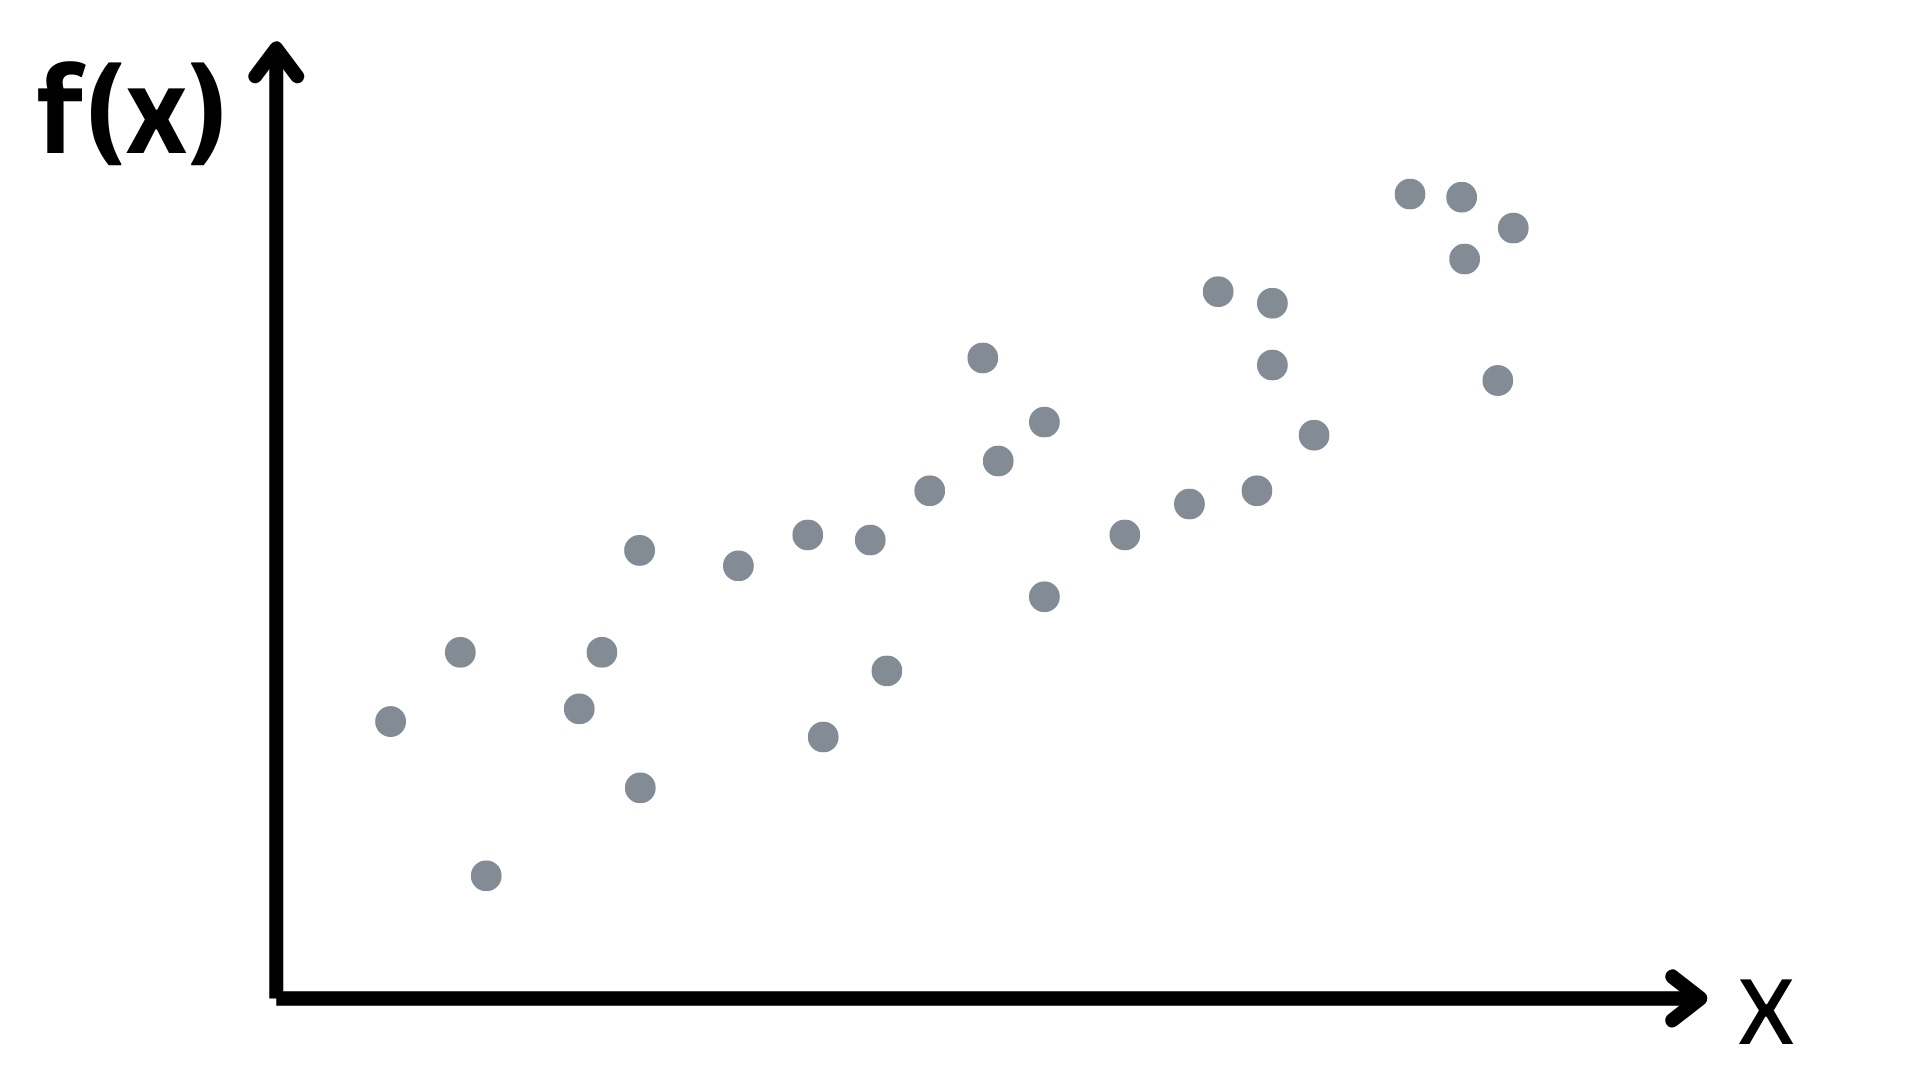
We start off in the same way with a data set of points.
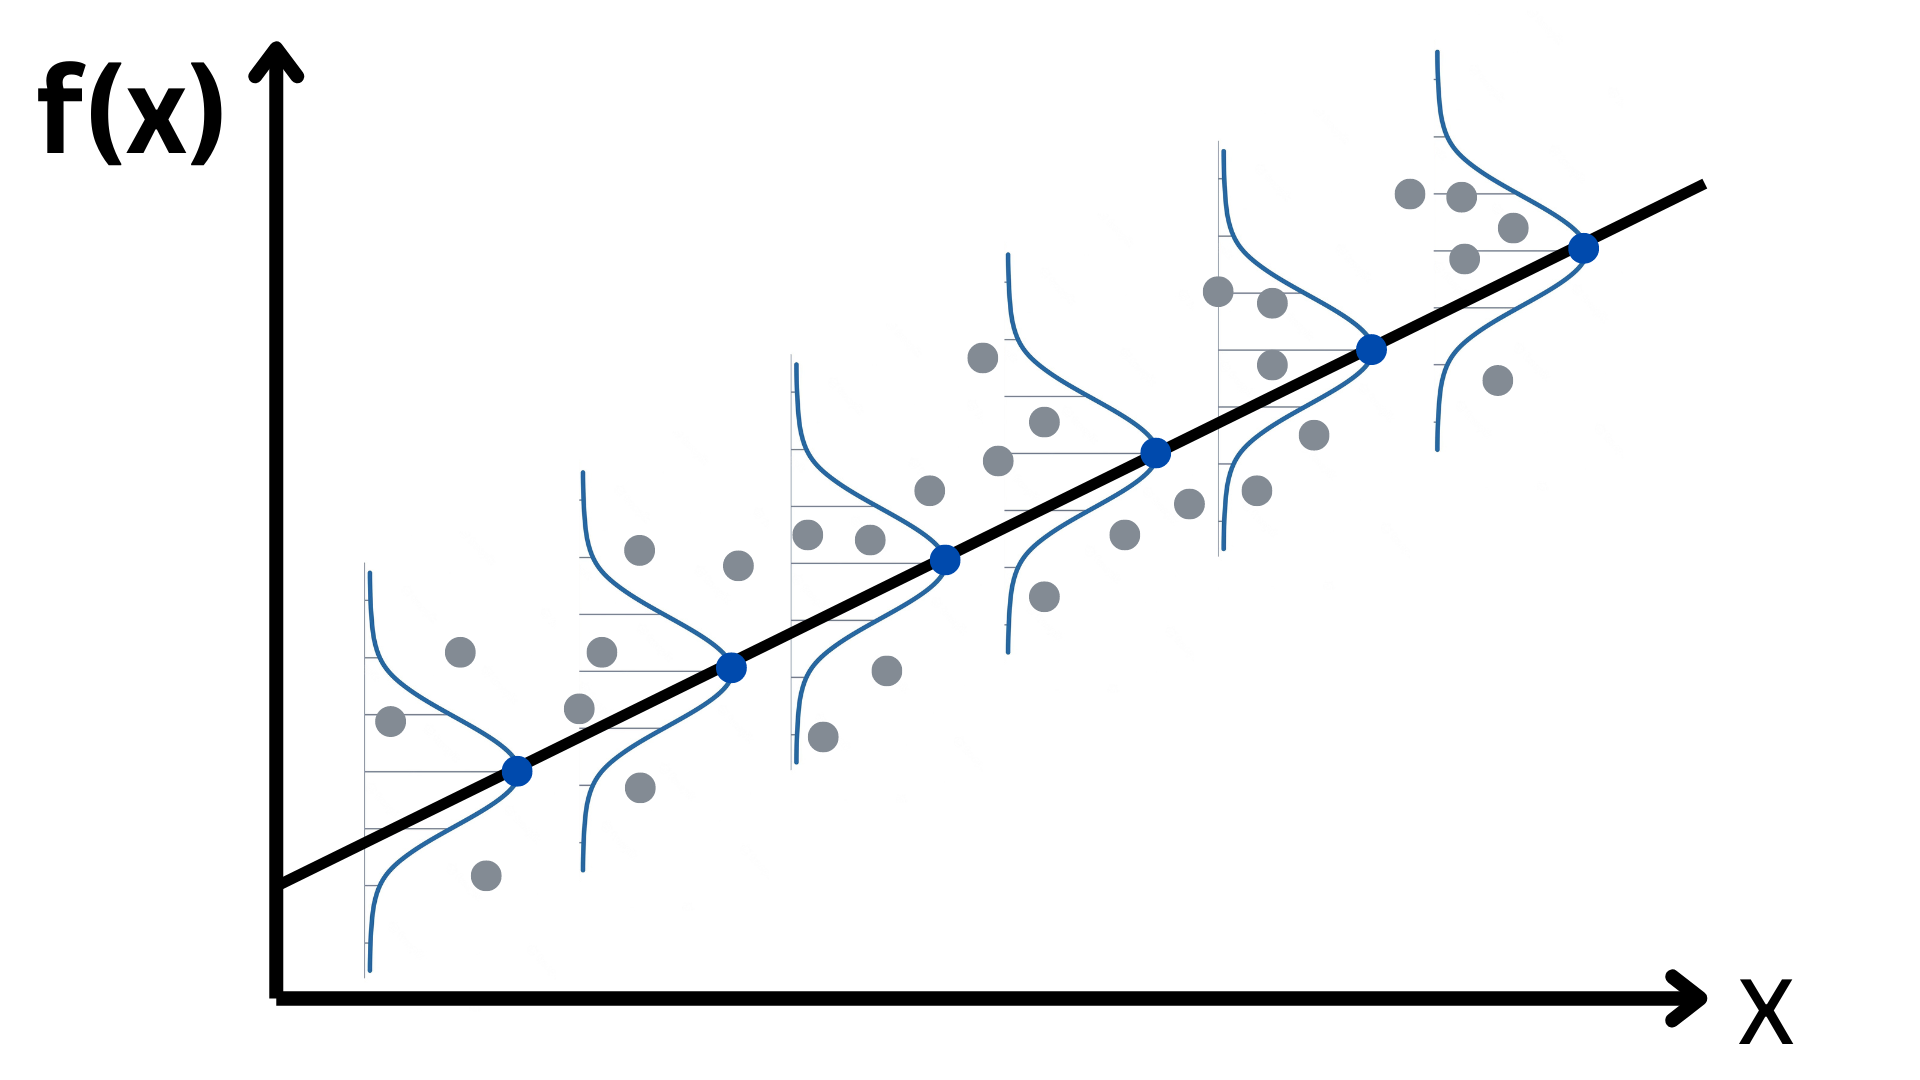
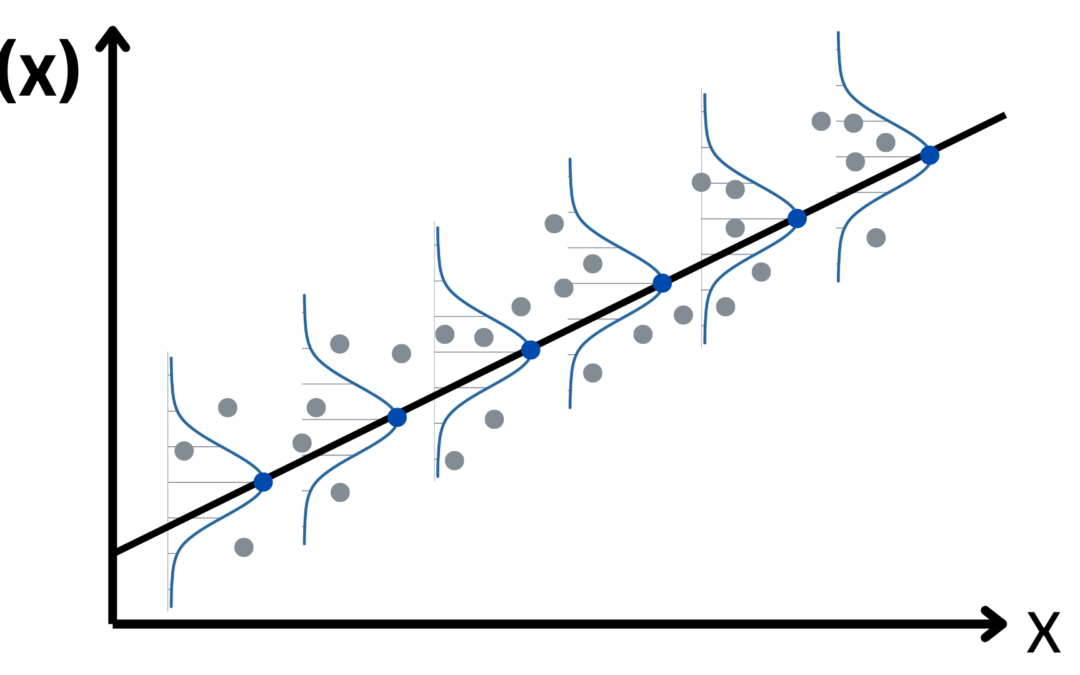
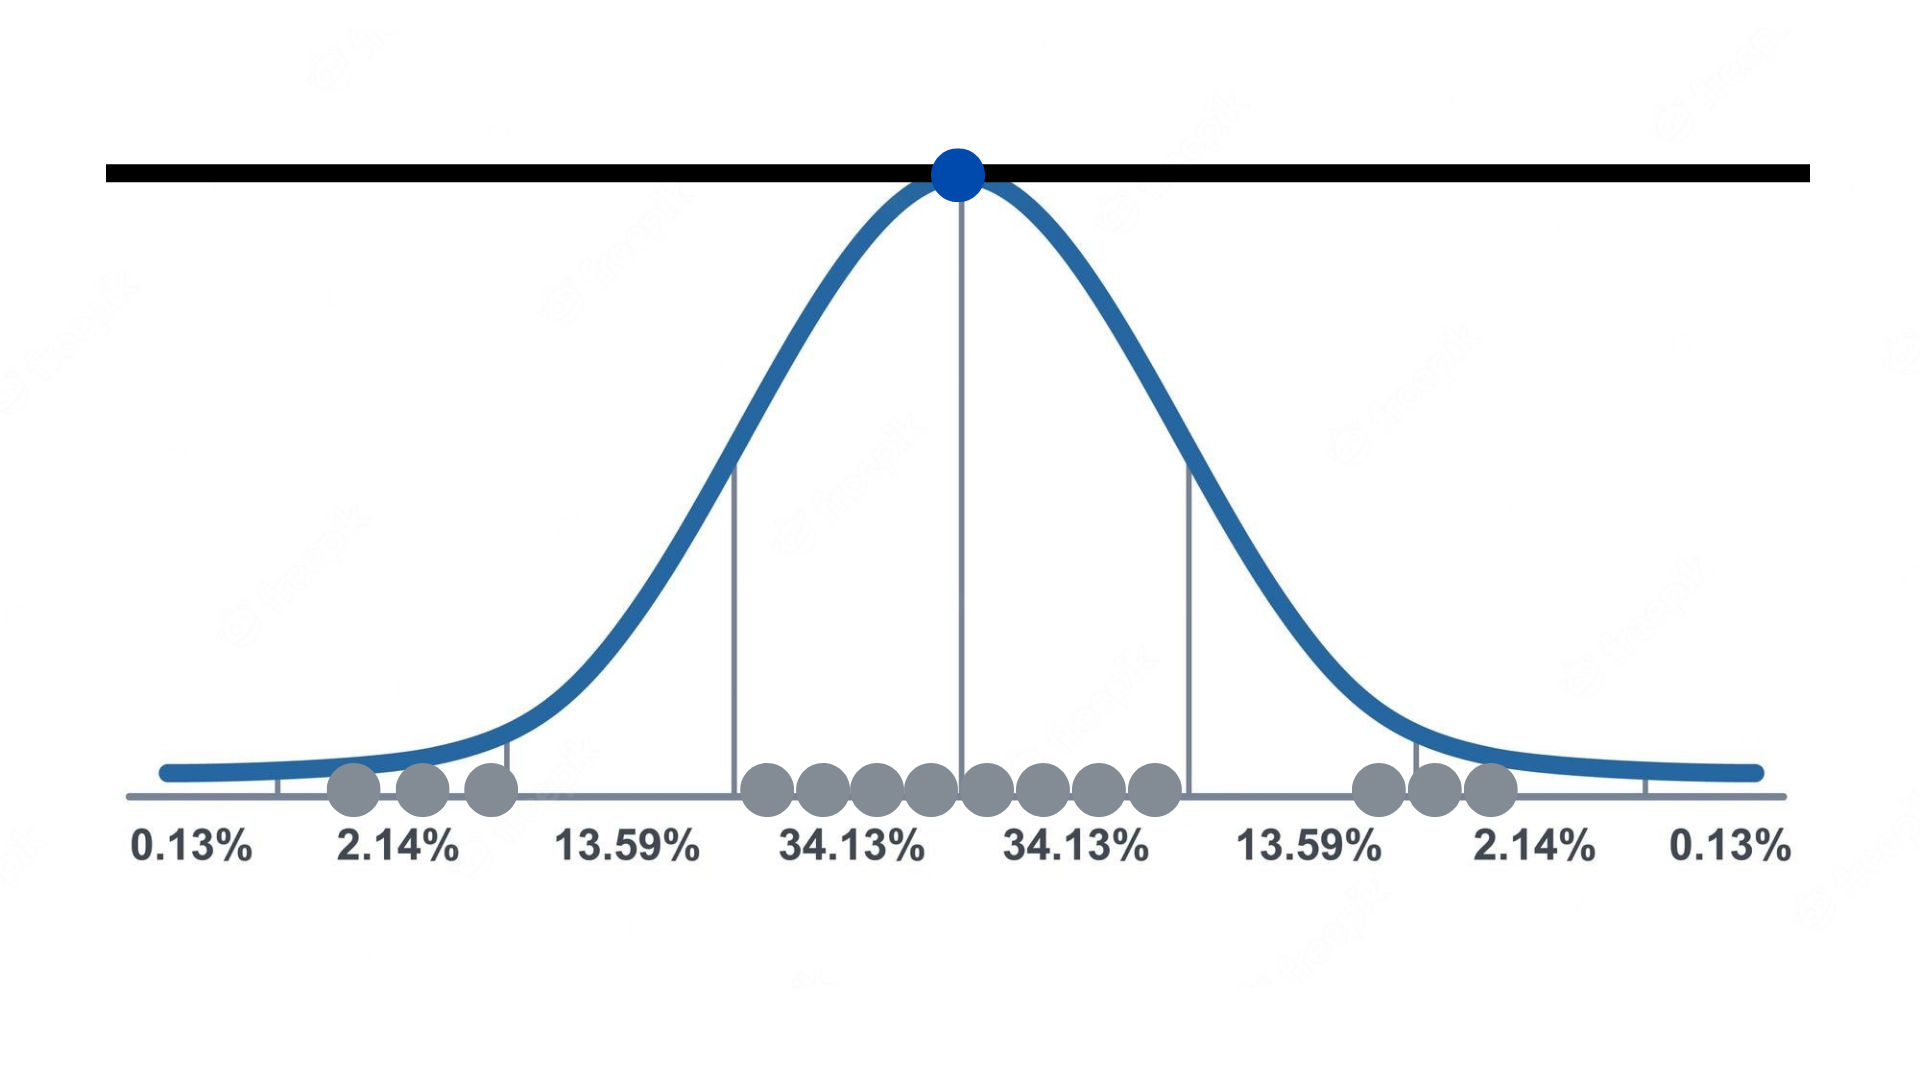
But here, along the Y-Axis in the same X-point we find the Normal curve the best fits the largest set of points.
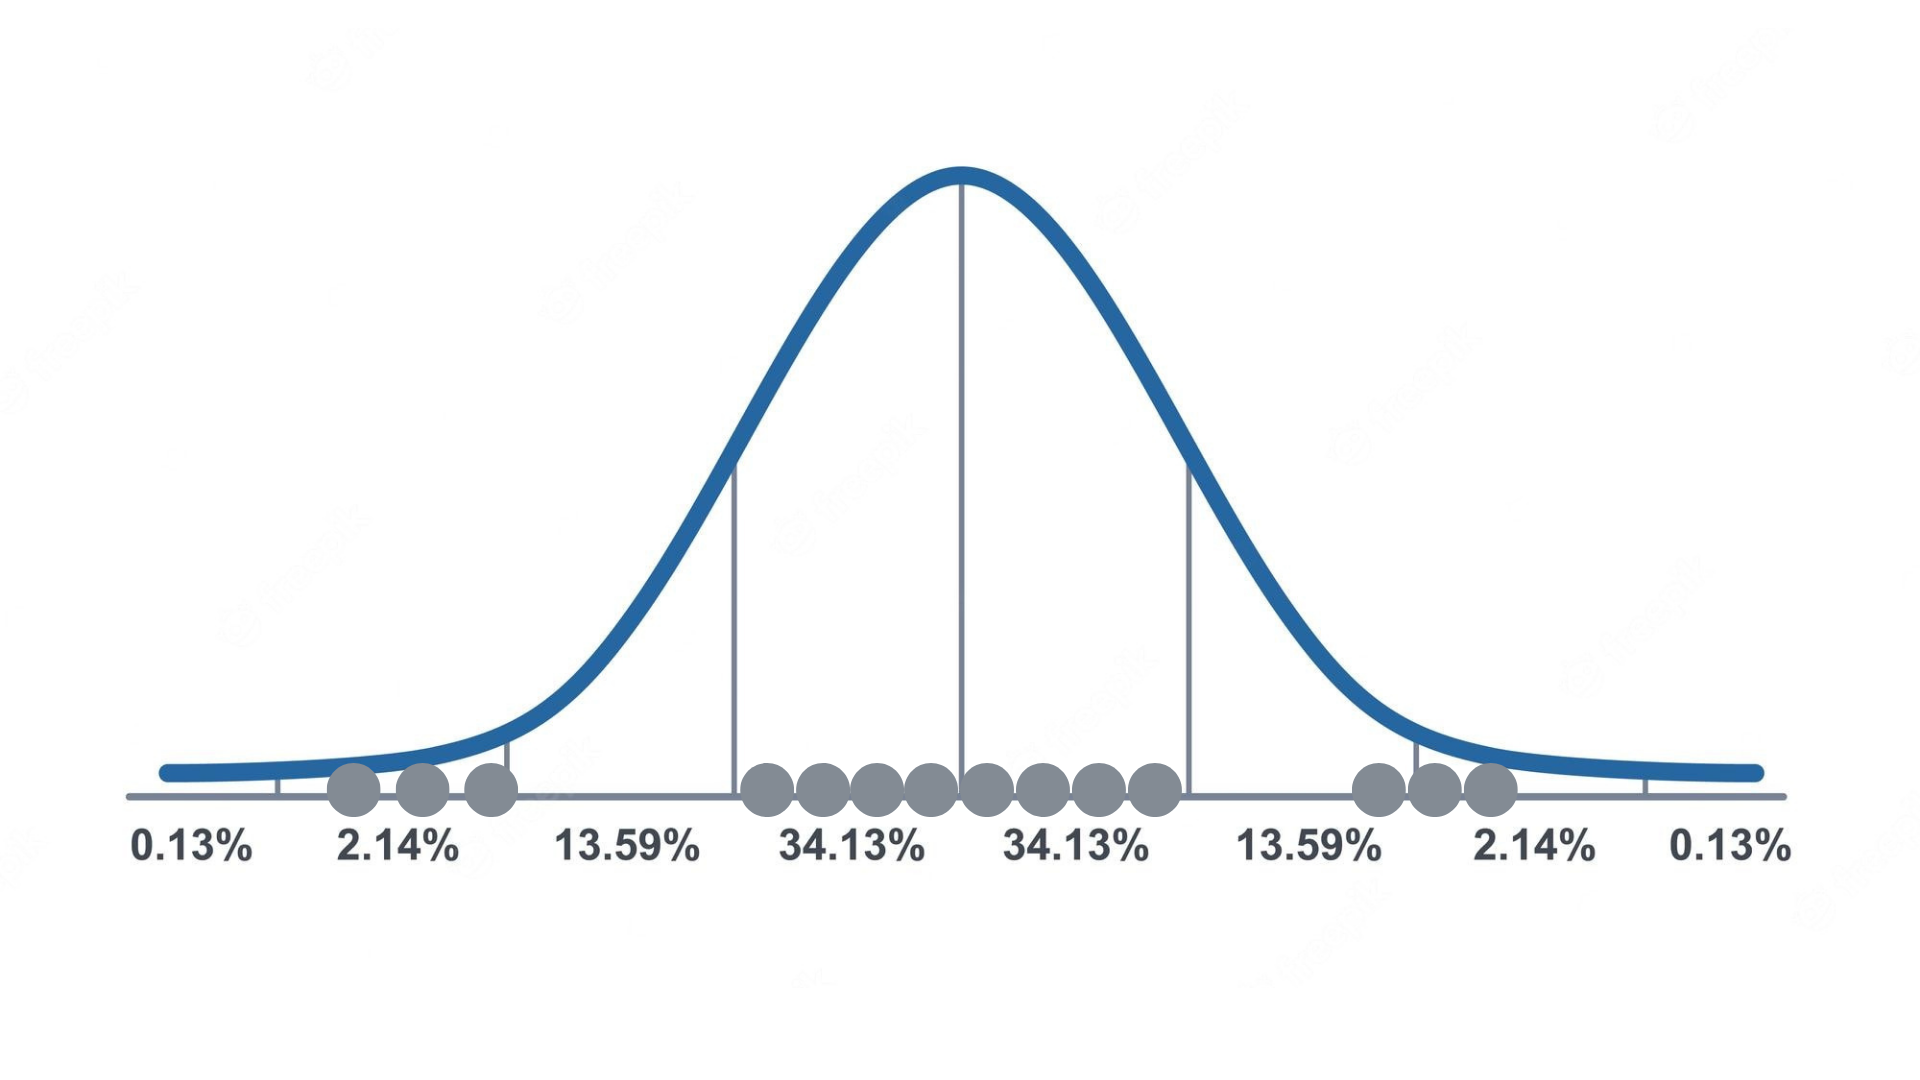
Because the normal curve has this unique characteristic of being bell-shaped, we use it to our advantage. In other words, given we have centered a normal curve where we have the most prevalance of points, where the first derivative is 0, we have the coordinate to use for the regression line.
We then proceed to apply this concept along all the dataset and find the maximum point at each vertical line, so we can then gather coordinates for our function.