
What are the costs of production?
In Microeconomics, there are 4 types of costs:
1. fixed costs
2. variable costs
3. total cost
4. average costs
5. marginal costs
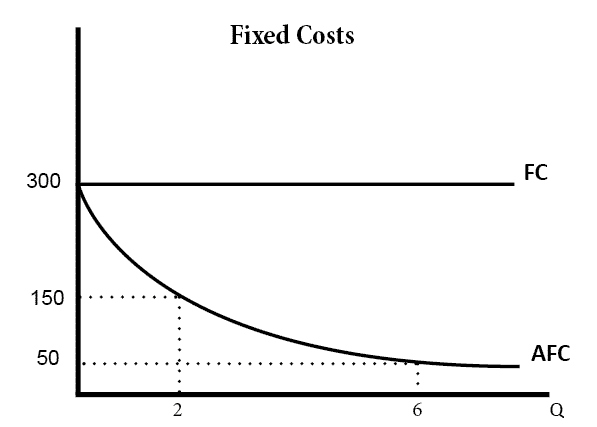
Fixed Costs
Fixed costs are the same if you are open for business or not: rent, food, utility bills.
Variable Costs
Variable costs depend on the output produced and are only incurred when producing output. Let’s say you have a food delivery business: you only pay the freelancer to deliver when you have an order, and you keep the margin. So that freelancer is your variable cost.
Total Costs
Total cost is the sum of fixed and variable costs.

From the graph above, you can see that if Fixed costs are the same, from a Math’s perspective it is a constant, so Y=some number: It is an horizontal line.
And since Total Costs are Variable Costs + Fixed Costs, the Total Costs curve shifts upwards because for every point in the variable curve we are adding the same constant from the fixed curve, essentially having the same representation of the variable curve shift upwards starting at the the fixed curve y value (notive the interception point between TC and TFC at the Y-Axis)
So, to summarize, to obtain the TC you add the TFC with the TVC.
Why the Squiggly line?
In the beginning, variable cost increases at a decreasing rate because revenue is increasing at an increasing rate: you use more dudes to deliver orders.
Later on, total cost increases at an increasing rate because revenue is increasing at a decreasing rate: you have more resources as a company, so now you use the same dude to deliver more orders.
Average Costs
Average Cost is the total cost divided by the total number of output produced: $1,000 in total costs(fixed+variable) / 100 pizzas = $10
Notice here that if the output keeps going up and the fixed costs are the same, this value will keep going down. $1,000 in total costs(fixed+variable) / 1000 pizzas = $1
Marginal Costs
The word Marginal means one more of. In our specific case, cost incurred by producing one more unit. It is given by the formula MC = Change in Cost/ Change in Quantity
Putting it all together
We know that the theoretical model where the firm earns zero economical profit is where MR = MC, so it makes sens that the Average Total Cost Curve meets both these lines at the sam intersection.
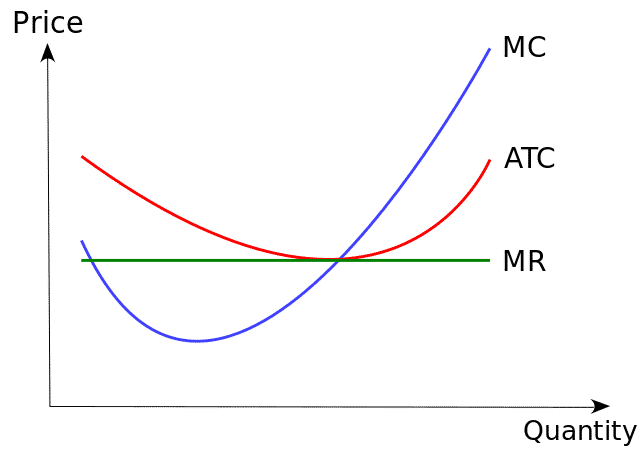
A bag of chips sells for the same price of $5.00 so it is a horizontal line in the graph represented by MR.
The firm’s cost to produce one bag of chips initially goes down as they hire more workers to produce more of it and the output of each one increases output effectively.
Since ATC represents the difference of the slopes between both curves, we can see that in the beginning, ATC goes down because MR is constant and MC is going down, so the slope is negative.
We then reach a point where the number of workers’ output is the most effective as each one’s contribution has the cost of the firm at its lowest point.
But then, as the company keeps hiring more workers, they start producing less, as each unit’s output is not that significant overall, so the MC starts going up again. This is called the Law of Diminishing Returns.
And Since ATC represents the difference between slopes, it starts going up again, until we reach a point where all three lines meet. This is where the firms earns zero economical profit.
