

What is Marginal Analysis?
Marginal analysis is the study of the additional economical benefits of doing a specific activity in comparison to the additional costs incurred by that same activity.
The world marginal refers to the cost-benefit relationship of one more unit. You can look at this from both ends:
From the cost side: “How much does it cost you to doing one more of this”
From the benefit side: “How much does it benefit you to doing one more of this”
We are essentially extending our understanding of cost-benefit analysis where we only do something or buy something if in doing so, the benefit ≥ cost
Marginal analysis takes this one step further and tells use How much should you do or buy?
So, under this logic, you should do more if Marginal Benefit ≥ Marginal Cost.
The word Marginal means additional unit.
To be clear, Marginal Cost means Additional Cost of An Additional Unit. On the same token Marginal Benefit means Additional Benefit of An Additional Unit.
This brings us to a key concept in Economics called Diminishing Marginal Benefit. This means that the Marginal Benefit decreases as Total Quantity Increases. As an example: the more you have of one product, the less you tend to value it.
Let’s say you are buying a cup of Starbucks Coffee at let’s say $9.00. Looking at it from a Marginal Cost perspective the price is always the same: $9.00. But from a Marginal Benefit, it is different: It is a mental auction process where you buy if the Marginal Benefit you get is higher than the Marginal Cost.
If you are valuing the item more than your money, you buy. It’s really cold, you are hungry, you value this first one more.
So although the price is $9.00, in your mind you are so hungry and cold, you would probably pay let’s say $12.00. This is your Marginal Benefit.
The net benefit in this transaction is $12.00-$9.00 = $3.00
But the second one is different: think of it as if you already had a Starbucks Coffee with you. If someone offered to sell another one to you, would you be willing to pay the same now that you already had one and were more comfortable than before where you didn’t have any?
So, although the price remains the same, you are valuing it differently given your level of satisfaction after consuming it.
So when you go ahead and buy another one, given that you already have some level of satisfaction by having consumed the previous one, you are now not that hungry, so you are evaluating this next one let’s say at $10.00.
The net benefit in this transaction is $10.00-$9.00 = $1.00
By acquiring the third one, you are not valuing it the same as you don’t need it that much, so let’s say you value it at $7.00 and so on.
The net benefit in this transaction is $7.00-$9.00 = – $2.00 and since you should only buy if the Marginal Benefit ≥ Marginal Cost, so in this particular instance, you wouldn’t buy more.
So from one end, you have the additional benefit of doing a specific activity, this is your marginal benefit.
On the other hand, you have the additional cost of doing a specific activity, this is your marginal cost.
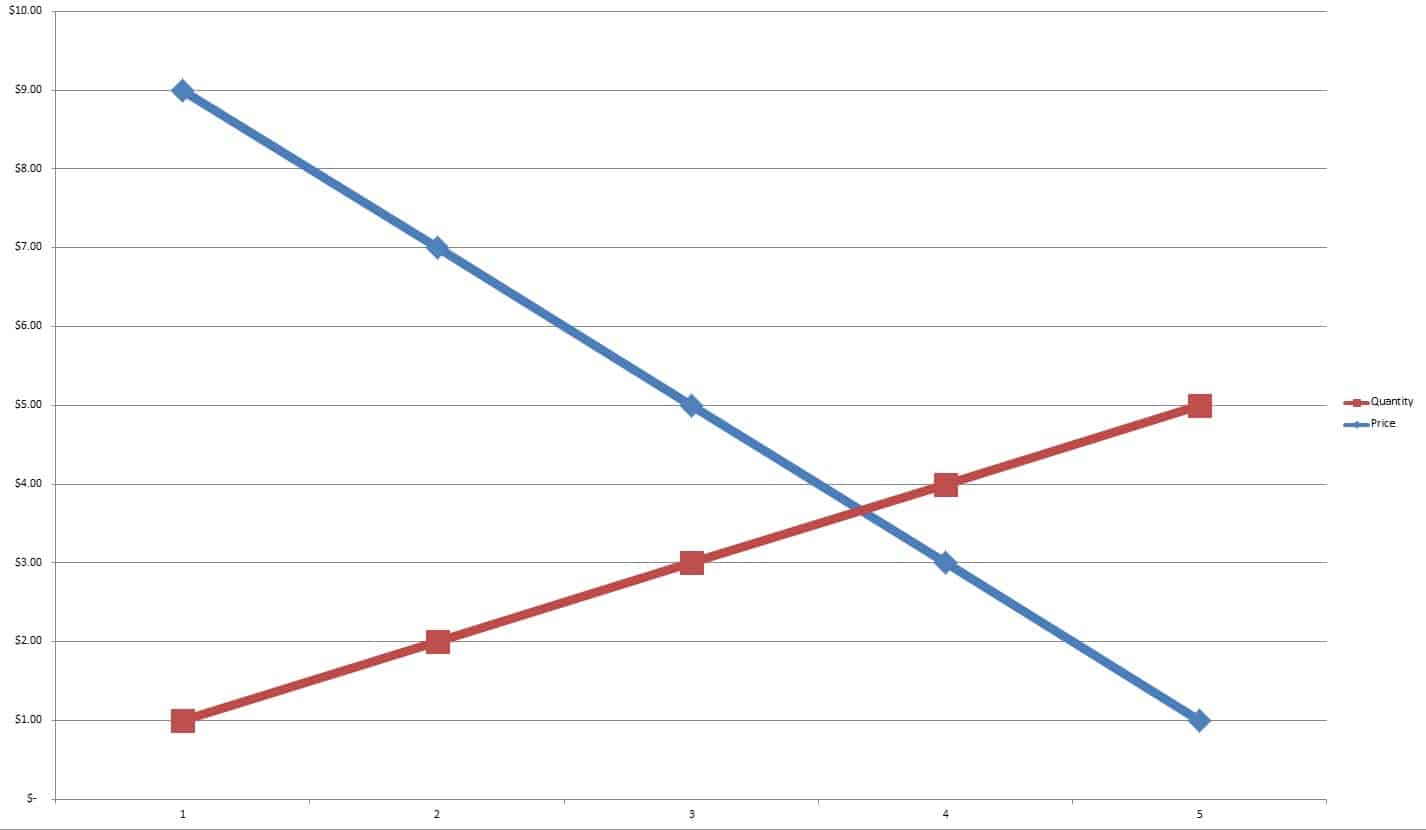
Connecting these values through a line gives you the marginal benefit curve and the marginal cost curve, or in other words the Demand and Supply curve.
Your benefit from an additional unit of that activity keeps going down, and on the other hand, the cost of doing an additional unit of that activity keeps going up.
The difference between both is your net benefit.
Demand And Supply Curves
Taking this a step further, if we want to know the slope of the Demand Curve, we can do that by using the formula:
Demand = Marginal Utility = Δy / Δx
Or in other words, the change in Y / the change in X.
So if you had let’s say:
Δy = 60-40 and Δx = 20-30
this would equal (60-40)/(20-30) = 20/-10 = -2
The number -2 represents the slope of the Demand Curve: for every 2 units change in the X-Axis, there is a -1 unit change in the Y-axis.

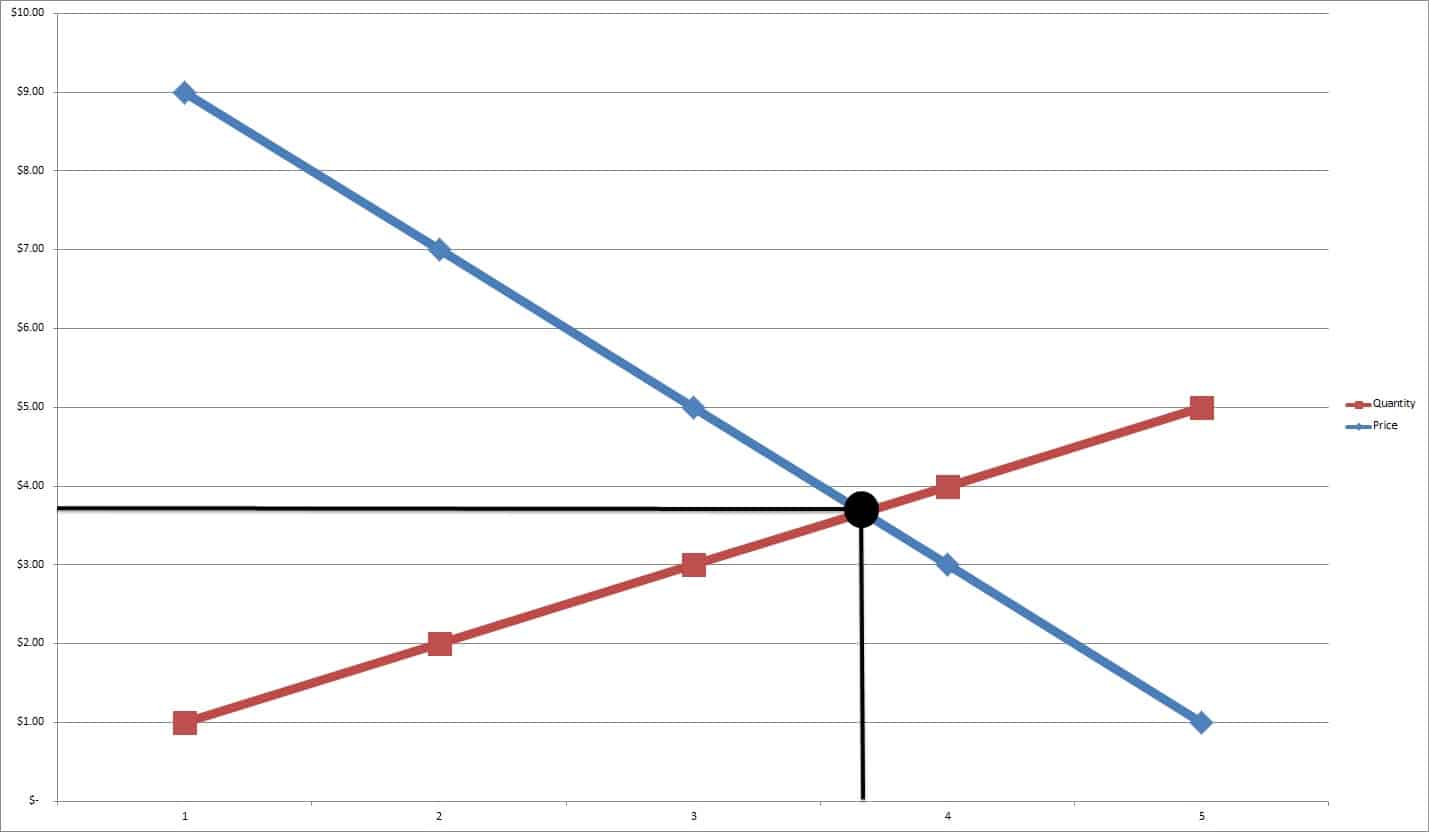
As your net benefit keeps going down, there is an important point which is where both lines intersect where your net benefit is 0. This is called the Efficient Quantity or Equilibrium, where Demand and Supply is balanced. At this point you are indifferent: you don’t gain anything, but you don’t lose anything either.
Economics call this point the Equilibrium, which is a point where there is a balance between the Demand and the Supply.
You can obtain the Equilibrium Quantity or the Equilibrium Price by equaling the supply equation to the demand equation to find the corresponding value.
So, remember:
Demand Curve = Marginal Benefit Curve (MB)
Supply Curve = Marginal Cost Curve (MC)
Efficient Quantity = Equilibrium Quantity = MB = MC
Now that we have an understanding of the utility and its corresponding demand and supply curves, we can now do a Marginal Analysis in a example.
We usually look at this in a table where in the column section we have represented:
Q = Quantity, TB = Total Benefit, TC = Total Cost, MB = Marginal Benefit, MC = Marginal Cost
The main point we are trying to establish is up until what point one should produce. In order to know that, this is the golden rule of Economics:
IF THE MARGINAL BENEFIT ≥ MARGINAL COST, DO IT. IF NOT, DON’T.
Having this principle in mind, let’s look at the following table:
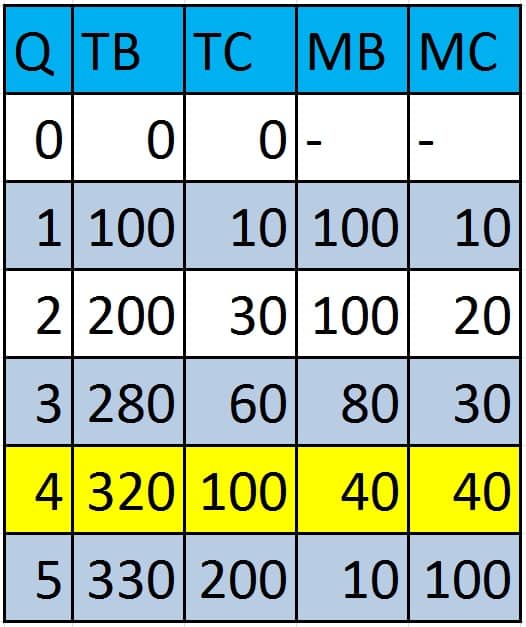
How do we obtain the values from MB and MC?
To answer this question, here’s the formula:
MB(RowN) = TB(RowN)-TB(RowN-1)
As an example MB(Quantity=2) = 200-100 = 100
MC(RowN) = TC(RowN)-TC(RowN-1)
As an example MB(Quantity=2) = 30-10= 100
By keeping this process we populate the table with the values of MB and MC.
So when asked up until what point should you produce, or in other words, what is the profit maximization quantity?
The answer is where MB=MC. in this case where Q=4
In Economics, the rule is that you should produce where Marginal Revenue = Marginal Cost.