
In our last article, we talked about the concept of unlimited wants with limited resources, so essentially you have to make an option, as your day has the same hour as everyone else.
So by choosing to develop an activity, you are choosing to specialize. This has value in the marketplace because if someone needs an accountant they will go to the accountant. If they need an architect, they will go to the architect as so on.
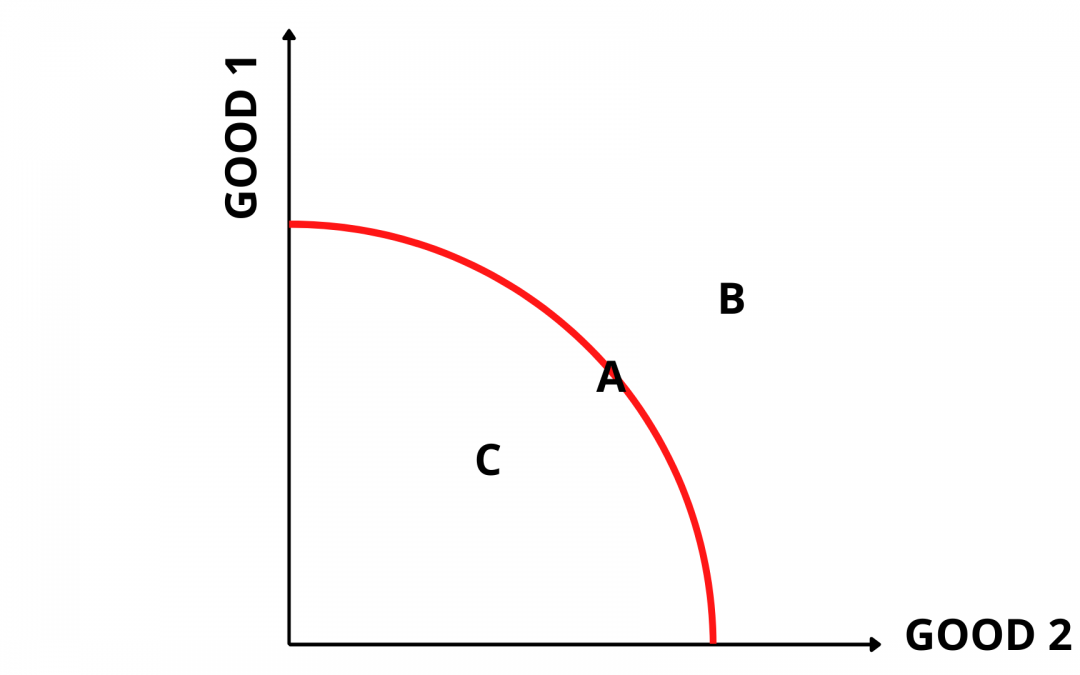
Taking into account this principle, there is a concept called Production Possibilities Curve or Production Possibilities Frontier, where we see the tradeoffs and possibilities available when portraying the possible outputs of production of a combination of 2 products or services.

Points A, B, and C show the possibilities:
A – Production at Optimum Level use of resources – this means that the Economy cannot produce a higher combination of Good a and Good 2 given its current resources.
This is also valid for a movement along the line. Let’s say right in the middle where you see A, 50 units of Good 1 are being produced + 50 units of Good 2. If in this Economy they produce 100 units of Good 1 and 0 of Good B, the Economy is still at optimum levels because it is utilizing its best possible resources to do so.
Let’s say Good 1 is Butter and Good 2 is Guns. The country goes to war so they allocate resources to produce more guns. The line stays where it is, it is just the point A that moves along the line towards Good 2.
Another way of seeing this is short-run vs long-run. Producing more of one good in the short run is just a movement along the production possibilities curve.
B – Not yet attainable – This means that due to lack of capital resources or technology, producing at this point is not yet possible.
Another way of looking at point B is specialization and Trade.
This increases Consumption Possibilities which makes points outside the curve possible.
Let’s say you are a door-to-door salesman and find a commercial real estate deal for $8.0, but you don’t have $8.0M
On another side is an investment fund that has billions of dollars of assets under management but no deals.
Both of you have this point B which represents an attainability given current resources.
But if you reach out to them and present the deal, you are specializing(staying within the scope of your resources and abilities). Each partie presents the missing resource to complete the transaction.
So, specialization and trade increases Consumption Possibilities which makes points outside the curve possible.
C – Underutilization of resources – This means that this Economy is underproducing as it has the means to be producing at A.
A good example of underutilizing resources is a recession. A country will have many unemployed workers who could be producing goods and services but aren’t because they are unemployed.

In the graph above there is an increase in the quality and resources in this economy. It is now possible to produce more of Good 1 and Good 2.
A good example is an increase in the working-age of the population.
There will be more labor available for the production of both Good 1 and Good 2. This shifts the whole curve outward.
Another example is the production of one good influences another. Let’s say Good 1 is Capital Goods and Good 2 is Consumer Goods.
If there is an advance that allows this Economy to increase its ability to produce more capital goods, this also has an impact on the output of consumer goods, so both shift the production possibilities curve outwards.
Another example would be a low-interest-rate environment. This would allow more consumption, which in turn would shift the production possibilities curve outwards as well.

Here is the reverse situation. There is a decrease in the quality and quantity of resources in the economy. The Country was devasted by war or a natural disaster, which impaired its ability to produce at the previous levels.
Just like the previous example, where the production of one good influences another. Let’s say Good 1 is Capital Goods and Good 2 is Consumer Goods.
If there is a decrease in the birth date there are fewer workers available to produce goods and services. This decreases the production of capital and consumer goods causing the production possibilities curve to shift inwards.

To be more specific with technological advances, if that would be the case but only for one good like Good 2, this would shift the production possibilities curve outwards for Good 2 while remaining unchanged for the Good 1

Same thing if there was a technological impairment in this Economy that would negatively impact its ability to produce Good 2. This would shift inwards the production possibilities curve for Good 2, leaving Good 1 unchanged.